Euro Pacific Bank

The Trade Server could not be reached

If you get the error message below when you login to GTS Pro

  1. Make sure your Internet connection is working normally. Open your browser try to visit any website, possibly one you don’t have in your recent navigation history to see if it loads without any problems.
  2. Look at the GTS Pro connection settings following the instruction available at https://europacbank.com/support/Troubles-logging-into-the-GTS-Desktop-Platform/
  3. Reboot the router. Some routers have a switch off/on power button, but most often you will have to simply unplug the power cable for about 20 seconds. After that it might take a couple of minutes for the connection to be re-established. Now please try again to login.
  4. Make sure the Firewall/Antivirus have our platform included in the trusted applications.

Troubles logging into the GTS Desktop Platform

If you are getting following error message: “… Auto-Detection failed”, please make sure you are connected to the Internet and that your Firewall/Antivirus is not blocking our platform, we strongly recommend you to add the Global TradeStation application to the firewalls allowed programs list.

Otherwise, please try to change connection settings of our Trading platform:

  1. At the login screen of the platform, click on the blue link “Change connection settings”
  2. Under the Protocol option you probably have by default “Auto detect”. Please try following available options: TCP with TLS Security or HTTPS with SSL security and click OK. Now try to login and check if the problem is solved. If not go back to Point 1 and 2 to try the next Protocol option:

If changing the Protocol has not solved the issue, please go through following suggestions:

If the above does not solve your problem, please create a case by sending an email to [email protected] and give exact details of the error seen (including a screenshot if possible).

Easter Trading Hours

Please see below for trading times during the Easter holiday period.

Instrument Thursday, March 29th Good Friday, March 30th Easter Monday, April 2nd Tuesday, April 3rd
FX Normal Hours Normal Hours Normal Hours Normal Hours
FX Metals Normal Hours Closed Normal Hours Normal Hours
Cryptos Normal Hours Normal Hours Normal Hours Normal Hours
AUS200 Normal Hours Closed Closed Normal Hours
GER30 Normal Hours Closed Closed Normal Hours
ES35 Normal Hours Closed Closed Normal Hours
FRA40 Normal Hours Closed Closed Normal Hours
JPN225 Normal Hours Closed Normal Hours Normal Hours
NED25 Normal Hours Closed Closed Normal Hours
EUR50 Normal Hours Closed Closed Normal Hours
SUI20 Normal Hours Closed Closed Normal Hours
GBR100 Closed at 19:00 Closed Normal Hours Normal Hours
NAS100 Normal Hours Closed Normal Hours Normal Hours
SPX500 Normal Hours Closed Normal Hours Normal Hours
US30 Normal Hours Closed Normal Hours Normal Hours
WTIOIL Closed Closed Normal Hours Normal Hours
BRENT Closed Closed Normal Hours Normal Hours

CME PRIIPS KIDs (Key Information Documents)

Packaged Retail and Insurance-Based Investment Products (PRIIPs) regulation in the EU, and new rules implemented by CME Group Exchanges, has prompted the provision of Key Information Documents (KIDs) below. In order to continue trading the below specified instruments on the GTS platform, it is of utmost importance for clients to be aware of the inherent risks involved, along with the associated reporting requirements when trading these instruments. Further information and updates may be found at the following links on the CME Group website for PRIIPS Options Products and PRIIPS Futures Products.


PRIIPS Options Product KIDs

Product Type  Transaction Key Information Document Date Costs Updated
English French German Italian Dutch Spanish
Commodities – Cash Settled
Lean Hog Options
Long Call link link   link link   1-Dec-17
Short Call link link   link link   1-Dec-17
Long Put link link   link link   1-Dec-17
Short Put link link   link link   1-Dec-17
Commodities – Physically Delivered
Chicago SRW Wheat Options
Corn Options
Crude Oil Options
Gold Options
Live Cattle Options
Natural Gas Options (American)
Silver Options
Soybean Meal Options
Soybean Options
Long Call link link   link link   1-Dec-17
Short Call link link   link link   1-Dec-17
Long Put link link   link link   1-Dec-17
Short Put link link   link link   1-Dec-17
Equity Indices
E-mini Nasdaq 100 Options
E-mini S&P 500 Options
Long Call link link   link link   1-Dec-17
Short Call link link   link link   1-Dec-17
Long Put link link   link link   1-Dec-17
Short Put link link   link link   1-Dec-17
FX Physically-Delivered
Premium Quoted European Style Options on Australian Dollar/US Dollar Futures
Premium Quoted European Style Options on British Pound/US Dollar Futures
Premium Quoted European Style Options on Canadian Dollar/US Dollar Futures
Premium Quoted European Style Options on Euro/US Dollar Futures
Premium Quoted European Style Options on Japanese Yen/US Dollar Futures
Long Call link link   link link   1-Dec-17
Short Call link link   link link   1-Dec-17
Long Put link link   link link   1-Dec-17
Short Put link link   link link   1-Dec-17
STIRs
Eurodollar Options
Long Call link link   link link   1-Dec-17
Short Call link link   link link   1-Dec-17
Long Put link link   link link   1-Dec-17
Short Put link link   link link   1-Dec-17
Treasury Bonds and Notes
10-Year T-Note Options
U.S. Treasury Bond Options
Long Call link link   link link   1-Dec-17
Short Call link link   link link   1-Dec-17
Long Put link link   link link   1-Dec-17
Short Put link link   link link   1-Dec-17

PRIIPS Futures Product KIDs

Product Type  Key Information Document Product Exchange Commodity Code CME Globex Code Underlying Index Costs Date Costs Updated
Total Costs Reduction in Yield Entry Costs Exit Costs
Agricultural – Cash Settled English
French
German
Italian
Dutch
Lean Hog Futures CME LN HE   $4.06 0.0144% 0.0072% 0.0072% 1-Dec-17
Agricultural – Physically Delivered English
French
German
Italian
Dutch
Chicago SRW Wheat Futures CBOT W ZW   $3.90 0.0178% 0.0089% 0.0089% 1-Dec-17
Corn Futures  CBOT C ZC   $3.90 0.0217% 0.0109% 0.0109% 1-Dec-17
Live Cattle Futures  CME 48 LE   $4.06 0.0083% 0.0042% 0.0042% 1-Dec-17
Soybean Futures CBOT S ZS   $3.90 0.0078% 0.0039% 0.0039% 1-Dec-17
Soybean Oil Futures CBOT 07 ZL   $3.90 0.0193% 0.0096% 0.0096% 1-Dec-17
Soybean Meal Futures CBOT 06 ZM   $3.90 0.0117% 0.0058% 0.0058% 1-Dec-17
Bitcoin  English
French
German
Italian
Dutch
Bitcoin Futures          $10.00 0.0105% 0.0052% 0.0052% 18-Dec-17
Energy – Cash Settled English
French
German
Italian
Dutch
E-Mini Crude Oil Futures NYMEX QM QM   $2.40 0.0082% 0.0041% 0.0041% 1-Dec-17
Energy – Physically Delivered  English
French
German
Italian
Dutch
Crude Oil Futures NYMEX CL CL   $3.00 0.0051% 0.0026% 0.0026% 1-Dec-17
RBOB Gasoline Futures NYMEX RB RB   $3.00 0.0041% 0.0021% 0.0021% 1-Dec-17
Henry Hub Natural Gas Futures NYMEX NG NG   $3.00 0.0098% 0.0049% 0.0049% 1-Dec-17
NY Harbor ULSD Futures NYMEX HO HO   $3.00 0.0037% 0.0018% 0.0018% 1-Dec-17
Equity  English
French
German
Italian
Dutch
E-Mini Dow ($5) Futures CBOT YM YM link $2.32 0.0019% 0.0010% 0.0010% 1-Dec-17
E-Mini Nasdaq 100 Futures CME NQ NQ link $2.36 0.0019% 0.0009% 0.0009% 1-Dec-17
E-Mini S&P 500 Futures CME ES ES link $2.36 0.0018% 0.0009% 0.0009% 1-Dec-17
Nikkei/Yen Futures CME N1 NIY link $4.30 0.0042% 0.0021% 0.0021% 1-Dec-17
FX – Physically Delivered  English
French
German
Italian
Dutch
Australian Dollar Futures CME AD 6A   $3.20 0.0042% 0.0021% 0.0021% 1-Dec-17
British Pound Futures CME BP 6B   $3.20 0.0038% 0.0019% 0.0019% 1-Dec-17
Canadian Dollar Futures CME C1 6C   $3.20 0.0041% 0.0020% 0.0020% 1-Dec-17
Euro FX Futures CME EC 6E   $3.20 0.0022% 0.0011% 0.0011% 1-Dec-17
Japanese Yen Futures CME J1 6J   $3.20 0.0029% 0.0014% 0.0014% 1-Dec-17
Metals – Cash Settled prodcuts  English
French
German
Italian
Dutch
Iron Ore 62% Fe, CFR China (TSI) Futures NYMEX TIO TIO           1-Dec-17
Metals – Physically-Delivered products  English
French
German
Italian
Dutch
Gold Futures COMEX GC GC   $3.00 0.0023% 0.0012% 0.0012% 1-Dec-17
Copper Futures COMEX HG HG   $3.00 0.0039% 0.0019% 0.0019% 1-Dec-17
Platinum Futures NYMEX PL PL   $3.00 0.0064% 0.0032% 0.0032% 1-Dec-17
Silver Futures COMEX SI SI   $3.00 0.0037% 0.0018% 0.0018% 1-Dec-17
STIRs English
French
German
Italian
Dutch
Eurodollar Futures  CME ED GE   $2.50 0.0010% 0.0005% 0.0005% 1-Dec-17
Treasury Bonds and Notes  English
French
German
Italian
Dutch
10-Year T-Note Futures CBOT 21 ZN   $1.50 0.0012% 0.0006% 0.0006% 1-Dec-17
U.S. Treasury Bond Futures CBOT 17 ZB   $1.60 0.0010% 0.0005% 0.0005% 1-Dec-17


New Account Section Coming to GTS

Table of Contents

Portfolio Overview

P/L and Cash Movements Tools

New Portfolio Overview

New Navigation

Historic Reports

Deposit and Transfer

Other Account Functions


Portfolio Overview

The new Performance Overview offers a dashboard showing your Account Performance, percentage returns and changes in cash value of the account (or all accounts) for the selected period

Account Summary

The Account Summary includes the:

  • Account Value at the start and end of the selected period and the Change in Account Value
  • P/L related to trading activities (trade P/L, costs, financing, corporate actions etc.)
  • Non-trading related bookings such as cash and security Transferred (interest, exchange subscriptions, exchange rate movements, etc.)

Account Value chart

The development of your account value over the selected period including cash and security transfers and everything booked on the account.

Instrument P/L

The Instrument P/L tab gives access to P/L breakdown for the selected account(s) and period.

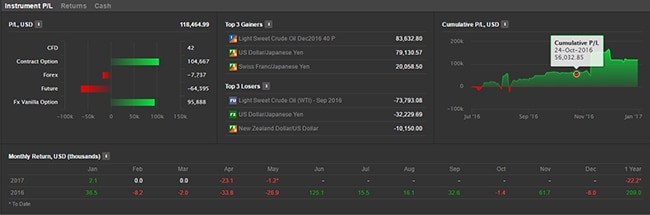
P/L figures In the Instrument P/L section include:

  • Realized gains and losses (positions closed in the period) 

  • Unrealized gains and losses (positions still open at the end of the period

  • All trading costs associated with a position such as holding costs, financing charges, rollovers, corporate actions, coupons, etc.
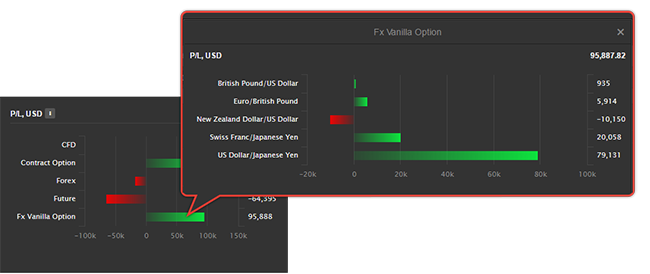
P/L Bar Chart

The P/L bar chart shows the net P/Ls for each product traded in the period.

Click on a bar to show the P/L breakdown for individual instruments traded in the period.

Top 3 Gainers and Losers

Top 3 Gainers and Losers show the 3 instruments with the greatest gain and loss in the selected period.

Cumulative P/L chart

The Cumulative P/L chart shows the development of the P/L on the account(s).

Monthly Return table

The monthly returns table shows the P/L by month since the account was opened.

Returns

Returns gives access to % returns for the selected account(s) and period:
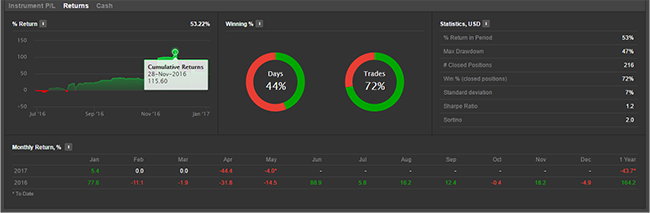
%Return Chart

The % Return chart shows the development as the time-weighted percentage performance over the period excluding cash and security transfers.

Winning % Indicators

  • The percentage of days in the period where your account had a profit/loss.
  • The percentage of closed trades in the period with a profit/loss.

Statistics

Account statistics for the selected period.

Monthly % returns table

The monthly returns table shows the % returns by month since the account was opened.

Cash

The cash panel shows the development of the cash balance for the selected account(s) and period.
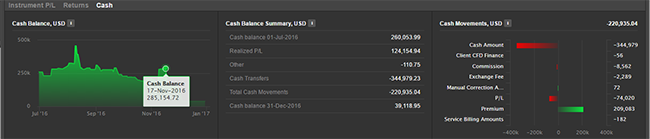
Cash Balance Chart

The % Return chart shows the development in the end-of-day cash balance over the period including cash and security transfers.

Cash Balance Summary

The Cash Balance Summary includes the:

  • Cash Balance at the start and end of the selected period and the Total Cash Movements in the period
  • Realized P/L from positions closed in the period (trade P/L, costs, financing, corporate actions etc.)
  • Cash Transfers and Other bookings from non-trading related bookings such as cash and security Transferred (interest, exchange subscriptions, exchange rate movements, etc.)

Cash Movements Bar Chart

The Cash Movements bar chart shows the net cash movement for each product traded, cash transfers and other booking types in the period.


P/L and Cash Movements Tools

P/L Analysis tools allows you to analyze P/L, associated costs and bookings down to the instrument level in detail. Analyze P/L by trading product, specific instruments or sectors, charting the cumulative P/L graphically or itemizing all transactions associated with product or instrument.

Profit/Loss

Profit/Loss allows you to analyze and show the cumulative Profit and Loss through trading an instrument, product or sector in a selected period.

For a selected period and account (or all accounts) you can analyze P/L by:

  • Asset Type to analyze P/L by product (FX, CFD, Stocks, Futures etc.) and drill down to the instruments traded within a product
  • Instrument to see the cumulative P/L development from trading a specific instrument
  • Sector (where sector information is available) showing P/L by instruments traded within each sector
  • Custom grouping P/L by any combination of Asset Type (product), month, year, sector, and instrument), for example, to show P/L by instrument, grouped by month traded (closed)

Cash Movements

Cash Movements allows you to analyze all bookings on your account (cash movements) associated with trading in a product or a particular instrument.

For a selected period and account (or all accounts) you can analyze bookings by:

  • Asset Type to analyze bookings by product (FX, CFD, Stocks, Futures etc.) to drill-down to bookings for each the instruments traded within a product
  • Instrument to see bookings for a trades in a specific instrument
  • Sector (where sector information is available), showing bookings by industry. This also allow you to drill-down to the instruments traded within each sector
  • Custom groupings showing bookings by any combination of Asset Type (product), month, year, sector, and instrument to show for example, bookings grouped by month traded (closed) for example

Closed Positions

For a selected period, Closed Positions shows positions that have been closed and booked on your account (or all accounts).

You can filter the Closed Positions by asset type (product) to limit the results shown.


New Portfolio Overview

The Portfolio Overview gives an overview of current net holdings on an account(s) and gives access to a historic view of the portfolio.

Allocation

The Portfolio Overview shows the following:

  • exposure to each instrument and product (in the currency of the instrument)
  • % allocation of the instrument of the holdings in that asset class (product)
  • % allocation of the instrument of the total portfolio

Current Account Values

The Portfolio Overview also gives shows the current cash available, value of positions and account value, and shows the % days change on the account.

Historic View

You can see how your portfolio looked historically at the end of any day using the date selector showing the account values, holdings and allocations at the end of selected.


New Navigation

The new Account Section introduces horizontal navigation aligned with the rest of the GTS platform. The simplified navigation reduces the number of Account Sections and maximizes the available space for reports.


Historic Reports

Historic Reports have been reorganized into tiles giving a better overview and description of the report.


Deposit and Transfer

Transferring funds and withdrawing funds to and from your account, security transfers have also been organized into convenient tiles in the Deposit and Transfers section of the Account Section.


Other Account Functions

Trading Conditions, Subscriptions, Activity log, Contact Support Upcoming Margin and Collateral Changes, Mifid Status, Corporate action events have been moved under the Other menu and re-organized as tiles with a description of the service.

Trading with Sub-Accounts

Establish sub-accounts for instrument currencies you commonly trade to eliminate paying conversion fees on each individual trade back to your account currency.

Notes about trading with sub-accounts

A few things to be aware of when trading from sub-accounts:

  • Whenever you trade you need to choose the specific sub-account you want to trade from – the platform does not automatically chose the most appropriate sub-account for you. However the platform will warn you if you try to place a trade on an account when a sub-account with a matching currency is available.
  • If you have two opposite positions in two separate sub-accounts, they will not net out at the end of the day.
  • When placing a trade, the platform takes into consideration the total funds and margin available to the sub-account, not only the assets available on the sub-account. If you do not have enough funds you will still be allowed to place trades on a sub-account if free funds or margin are available in other accounts. 
  • If you trade on a sub-account which has insufficient funds or margin, you may get a negative balance on the sub-account and will be charged interest on this negative balance. To avoid this, make sure you keep your sub-account balances positive.
  • You always need to maintain sufficient funds in your main account to cover your Net Free Equity requirements.
  • You can easily transfer funds between sub-accounts using the currency conversion request . The conversion rate will be the current exchange rate plus a conversion fee.

Introduction to Carrying Costs and Holding Fee

EFFECTIVE DATE: AUG 1ST, 2017

The global standards on bank capital (the Basel agreements) set stronger prudential rules for banks to keep sufficient capital reserves and liquidity to make them even more solid. These regulatory requirements are increasing the cost of holding the client’s positions and conducting business in Futures, Listed Options, and Expiring CFDs.

Therefore, as of August 1st, 2017, we will be introducing the following:

  • Carrying Cost on Futures, Listed Options, and Expiring CFDs
  • Holding Fee on bought Listed Options (above 120 days maturity)

Carrying Cost on Futures, Listed Options and Expiring CFDs

Overnight positions in Futures, Listed Options and Expiring CFDs will be subject to a carrying cost. The carrying cost will be calculated on the basis of the daily margin requirement and applied when a position is held overnight.

The funding rate used for calculating the carrying cost is based in the relevant Interbank-rate + markup (e.g. 150 bps).

Carrying Cost = Margin requirement * Holding time * (Relevant Interbank rate + Markup) / (365 or 360 days)

EXAMPLE: You BUY 1 Futures Contract in E-mini S&P 500 with a margin requirement of USD 5,500 and hold the position for 5 days.

Nominal Value 115,000 USD
Margin Requirement: 5,500 USD
   
Holding time: 5 days
1M USD LIBOR rate: 1.00%
Markup: 1.50%
   
Carrying cost: 5,500 * 5 * (1.00%+1.50%) / 360 = 1.91 USD

Holding Fee on Long Positions in Listed Options

From 1 August 2017, a Holding Fee on bought long dated Listed Options will apply.
The Holding Fee varies depending on the underlying asset class (Category) and will only apply to bought options with maturity beyond 120 days.
The fee will be calculated based on the below schedule and charged end-of-month.

Bought Options daily holding fees per million (Nominal Value)
Category Interest Rates Foreign-exchange rates and Gold Equities Precious metals, except gold Commodities, except precious metals
 <120 days maturity N/A N/A N/A N/A N/A
 >120 days maturity 0.10 0.70 1.10 1.00 1.60

Holding Fee per day = Nominal Value / 1,000,000 * Underlying Category Fee

EXAMPLE: You BUY 1 PUT Option on Coca-Cola Co, Expiry in 160 days, Strike 40.

Nominal Value 4,000 USD (Strike Price * 100 shares)
Category: Equities (>120 days maturity)
Fee per million: 1.10 USD
   
Holding Fee per day: 4,000 / 1,000,000 * 1.10 = 0.0044 USD

May 2017 New Products & Platform Updates

Futures Position Management Changes (Reminder)

GTS is moving to FIFO netting on futures positions from:

  • 27 May 2017 on the GTS-web platform, and not April 8th as previously communicated

This means that futures trades must be closed in the order they were opened; platform features which allow you to close trades in a different order will be removed:

  • Individual trades in a position cannot be closed directly.
  • You cannot place related stop and limit order to close specific trades.

Closing positions

To close or reduce a position, traders can place a trade using either the Close button on the position or by placing a trade using the Trade Ticket.

Related orders

Stop loss and take profit orders cannot be related directly to individual trades. Independent stop and limit orders can be placed instead and managed separately to the position if traders manually close a position, they must also manually cancel any orders.

These changes have already taken effect in GTS Pro, as described in last month’s update:

https://europacbank.com/support/april-2017-new-products-platform-updates/

One-Cancels-the-Other (OCO) Order to be added for Futures in GTS

One-Cancels-the-Other (OCO) order type for futures contracts will be added in GTS Pro and GTS-web platform on 27 May 2017, which will allow traders to continue placing Take Profit and Stop Loss futures orders with an OCO link, after the related order functionality for futures has been removed.

The controls for placing the Take Profit and Stop Loss orders can be toggled between a fixed Price or a distance in Percent from the current market price.

Input Field Usability Improvements in GTS

On 27 May 2017, usability improvements will be made around the price control toggle between Pips/Percent/Price in all Take Profit and Stop Loss dialogs.

Currently all available input types – Pips/Percent/Price – are shown in the main dialog. Traders choose which one to use and populate it with a value. The others input types remain empty in the dialog.

In the new dialog, the input type choice is brought up on the same level as Take Profit and Stop Loss. If a trader would want to change between input types (e.g. from Pips to Percent), click on the price control for the drop down arrow to appear and click again to choose another input type.

April 2017 New Products & Platform Updates

US corporate and LATAM bonds now available

We are pleased to announce the most recent addition of US corporate and LATAM bonds:

  • US corporate bonds include Investment Grade bonds and more high-yield bonds.
  • LATAM bonds include the most actively-traded USD corporate and government bonds from Brazil, Argentina, Venezuela and other Latin American countries.

Bond commissions

As an introductory offer, bond trading was available on very low commissions of 0.08%. From 1 April 2017, commissions have increased to 0.2% for both online and offline-traded.

Futures position management changes

GTS is moving to FIFO netting on futures positions from:

  • 6 April on the GTS Pro platform
  • 8 April on the GTS-web platform

This means that futures trades must be closed in the order they were opened; platform features which allow you to close trades in a different order will be removed:

  • Individual trades in a position cannot be closed directly
  • You cannot place related stop and limit order to close specific trades.
  • Closing positions

    To close or reduce a position, you can place a trade using either the Close button on the position or by placing a trade using the Trade Ticket

    Related orders

    Stop loss and take profit orders cannot be related directly to individual trades. Independent stop and limit orders can be placed instead and managed separately to the position ñ if you manually close a position, you must also manually cancel any orders.

    Changes to Allocation Summary

    In connection with the futures position management changes in the beginning of April, the Allocation Summary will be changed:

    • For futures contracts, the Close Allocated Positions Ticket will be changed to allocate futures orders/trades which are not related to opening trades.
    • The Close Position buttons on the trade level in the Allocation Summary will be removed for all products.

January 2017 New Products & Platform Updates

Product Updates

Fully Digitized Bonds Coming Soon

We are proud to announce the launch of online bond trading coming soon to GTS. With this revolutionary shift in bond trading, clients will gain access to transparent, cheaper, and more efficient trading of fixed income products. Whereas most bond trading is only available over a slow, inefficient manual “request-for-quote” basis, this will allow clients to utilize the full range of prices and liquidity available in the market to execute most orders within seconds. More information will follow later this month.

Greeks Now Available on CME Globex Futures

Greeks and implied volatility are now available on Futures Options traded on the CME Globex exchanges in the Option Chain and Trade Tickets in GTS and GTS Pro.

Single Stock CFDs with a US Equity as Underlying Asset.

IRS Section 871(m) is a new piece of regulation from the US tax authority (the IRS) and the US Treasury Department. Its aim is to impose tax on dividend-equivalent payments for derivative instruments with a US-based underlying equity. The regulation will come into effect on January 1st 2017. Positions entered into on or after this date will be subject to tax on any dividend payment. Listed options with a US equity as an underlying asset will also be covered by similar legislation from January 1st 2018. For more information, please see: here

Platform Enhancements

Option Positions Itemised Separately in Account Overview

To improve breakdown of the Account Value across cash, margin and Option positions, the value of Options positions will be itemised separately in Account Overview.
Currently, in the Account details in GTS and GTS Pro:

  • The value of FX Options is currently included under P/L, Margin Positions
  • The value of Exchange Traded Options is currently included under Market value, Cash Positions
  • A new dedicated Value of options field will be added in January 2017 and the values of FX and Exchange Traded Options will be moved to this new field.

LAST UPDATED: APRIL 16, 2024

August 29, 2022: Euro Pacific Bank liquidation has commenced. Please read our formal instructions here as it is time-sensitive.

September 2, 2022: Update on pending transactions, brokerage, and account migration.

September 8, 2022: Qenta has emailed a welcome letter to all EPB clients. You can read a copy of it here.

September 16, 2022: Update on pending transactions for clients opting out of Qenta Inc. migration.

September 28, 2022: Update on pending transactions for clients opting out of Qenta Inc. migration.

September 30, 2022: Update on bank liquidation, pending transactions, and migration of assets to Qenta Inc.

October 8, 2022: Update on opt-out deadline for EPB clients who do not wish to migrate their account to Qenta Inc..

October 14, 2022: Customer Update & Townhall.

October 21, 2022: Update on Opt-out deadline - Extended.

November 01, 2022: Mutual funds & outgoing wire requests update.

December 05, 2022: Migration & liquidation update.

December 16, 2022: Comprehensive FAQ is published.

January 27, 2023: Correspondent bank update.

March 8, 2023: Migration & liquidation update.

March 31, 2023: Migration & liquidation update.

April 20, 2023: Liquidation update- Action required.

May 05, 2023: Migration & Liquidation update.

May 31, 2023: Migration & Liquidation update.

June 17, 2023: Receiver's report.

June 23, 2023: Migration & Liquidation update.

July 20, 2023: Migration & Liquidation update.

September 01, 2023: Migration & Liquidation update.

September 22, 2023: Report & Communication Portal.

September 22, 2023: Report & Communication Portal.

November 20, 2023: Progress Report (Opt-out Only).

November 21, 2023: Migration Update (Opt-in Only).

February 02, 2024: Migration & Liquidation update.

February 19, 2024: Migration & Liquidation update.

March 03, 2024: Migration & Liquidation update.

March 11, 2024: Receiver's Reports.

April 13, 2024: Migration & Liquidation update.

April 16, 2024: Receiver's Reports.