Product Updates & Enhancements
FX trailing stop order handling
From 19 December 2018 we have implemented a small but significant change to the way that we handle FX trailing stop orders.
- -Trailing stop if offered orders to sell will now follow the bid price (previously they followed the offer). They will continue to be triggered on the offer price.
- -Trailing stop if bid orders to buy, will now follow the offer price (previously they followed the bid). They will continue to be triggered on the bid price.
Previously, where a trailing stop if offered order to sell followed the offer price, spread widening would result in the stop order being dragged higher by a temporary spike. When the spread returned to normal levels, the stop order would then be triggered resulting in unexpected trailing stop behaviour.
We have therefore made this small change to protect clients from unexpected order fills as result of spread widening around market volatility or market opening e.g. Sunday open.
New chart features
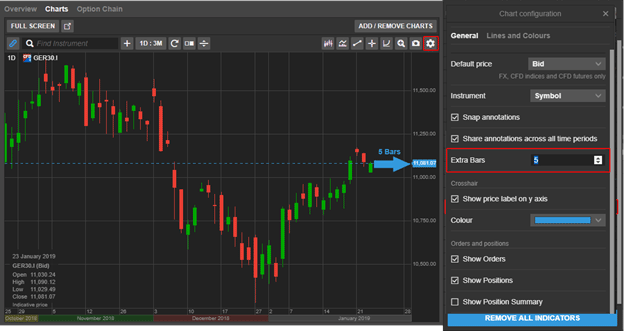
Extra bars
Extra Bars is a useful new feature that allows you to create space between last updated bar or candle and the y-axis, adding space for projecting annotations into the future.
You can add space from chart configuration menu available from the right-click menu (desktop) or the chat settings icon.
Annotation persistence across chart windows
Chart annotations are now remembered for each instrument and will be available whenever you open a new chart for the instrument.
If you have several instances of a chart open for the same instrument, the most recent changes to the chart annotations will be used.
Time range persistence when zooming
If you zoom or pan in the chart, the chart now persists the time range if you close and reopen the platform, detach the chart or select another instrument. If I pan the chart to show a time range of 2016 – 2017 for example, opening a new instrument in the chart will show the time range 2016 – 2017.
Click on the Reset icon ![]() to quickly reset to the time range selected.
to quickly reset to the time range selected.
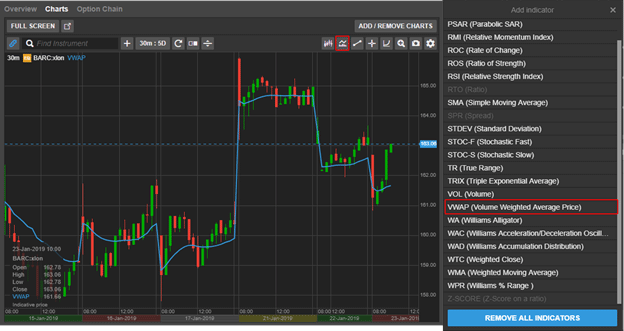
Improved Volume Weighted Average Price (VWAP) indicator (9th February)
The calculation behind the Volume Weighted Average Price (VWAP) indicator will be improved to more accurately display the average weighted price by volume – the value of all trades in a trading session divided by trading volume.
VWAP is similar to a moving average with a lagging indicator used on intraday time periods only. Contrary to the moving average, VWAP accumulates volume throughout the trading session.
VWAP can be used to compare the current price to the VWAP value to determine the general direction for the instrument – if current price is below the VWAP line prices are falling, if above prices are rising.
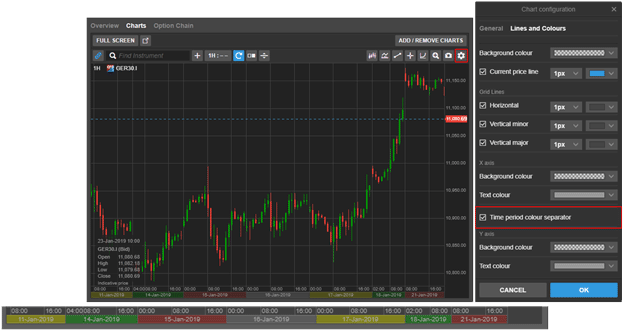
X-axis time period colour separator (9th February)
To improve the readability you will be able to add colours to the x-axis to make it easier to quickly identify different trading periods.
Go add colours to the time period under Chart Configuration > Lines and Colours the check the Time period colour separator checkbox
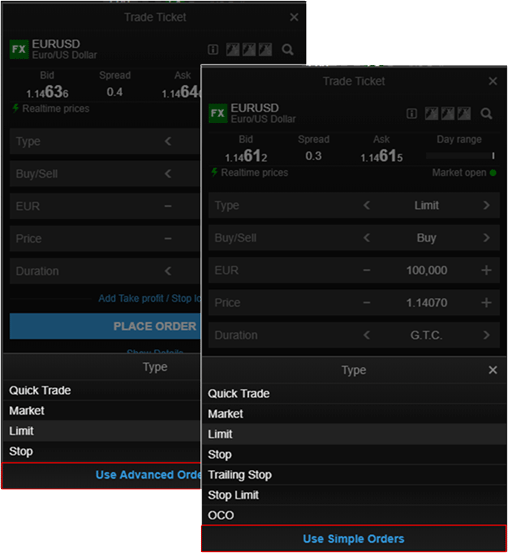
Simple order types in GTS Web
From February, an option will be available in the Trade Ticket when placing orders, allowing you to simplify the order types, hiding complex order types and limiting the list to Market, Limit and Stop orders used by most clients.
Design updates
A number of design updates to GTS Mobile will be released in the coming months. In close contact with clients, we have been making a number of usability improvements to the mobile trader. Most notably we will increase the font sizes and certain navigation buttons and icons to improve legibility and navigation.
Font sizes will also be increased on GTS Mobile on the desktop.
A number of enhancements will soon be released in the GTS Pro platform allowing traders to more efficiently navigate the platform using the keyboard.
FX stop order simplification
From February 2019, FX stop orders will be simplified where Stop if Bid and Stop if Offered will be labelled Stop orders throughout the platform in trade confirmations and order and position lists. Similarly, Trailing stop if Bid and Trailing Stop if Offered orders will be labelled Trailing Stop orders.
These orders will continue to be placed and triggered in the same way.
Operational Changes
Mandatory event notifications and corporate actions on Bonds
To provide better service clients, we are happy to announce that from 4th February 2019:
Notifications on mandatory corporate events
Corporate Action Notifications will be provided on mandatory events for Stocks, Bonds and Mutual Funds.
Clients can access this information under Account > Other > Corporate Action Mandatory Events. Events will be shown until their Ex date/effective date + 30 days.
Equity Research services discontinued
Equity Research available through the platforms will be discontinued in April 2019.
We are working on a replacement for this service which will be available before the Equity Research is retired.
Spot metal XPDUSD to be discontinued
Due to a deterioration in the underlying liquidity available in XPDUSD, we are no longer able to support trading in Palladium/USD.
From Monday 21 January 2019 clients are no longer be able to open new positions in XPDUSD and by Friday 15 February 2019 all existing positions must be closed. After this date, we will close all open positions and cancel any open orders on your behalf.
Please note that should you wish to gain exposure to Palladium, we continue to offer trading of Palladium CFDs and Palladium (PA) Futures.


