Euro Pacific Bank

Applying for Interactive Brokers

This article is intended for clients who do not qualify for Euro Pacific Trader and would like to open an account directly with the retail division of Interactive Brokers. Please use the follow application links based on your account type and/or resident country.

Individual Accounts

Click HERE if you would like to apply for an individual brokerage account at Interactive Brokers.

Joint Accounts

Click HERE if you are applying jointly with another individual and you are residing in any of the countries below.

  • Denmark
  • France
  • Germany
  • Ireland
  • Spain

Corporate Accounts

Click HERE if you are applying for a corporate brokerage account and you are residing in any of the countries below.

  • Austria
  • Cyprus
  • Finland
  • France
  • Germany
  • Greece
  • Ireland
  • Italy
  • Malta
  • Netherlands
  • Poland
  • Portugal
  • Slovakia

If you are residing in Canada and are applying for a corporate brokerage account, click HERE to apply.

Portfolio Commentary: Bond Market Tumbled amid Market Headwinds

Published: May 13, 2022

euro pacific advisors fund manager portfolio 
commentary

Relevant Strategies

  • International Balanced
  • International Growth
  • Natural Resources
  • Gold and Precious Metals
  • Peter Schiff

Our Commentary

Market overview

April was the month reality set in for investors that the myriad headwinds facing the global economy and financial markets are not about to alleviate any time soon and could magnify beyond current expectations.

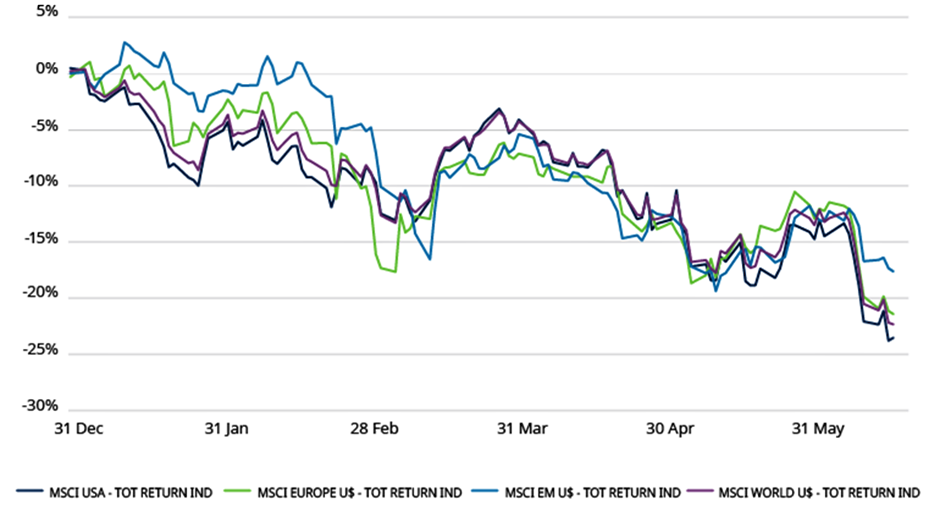
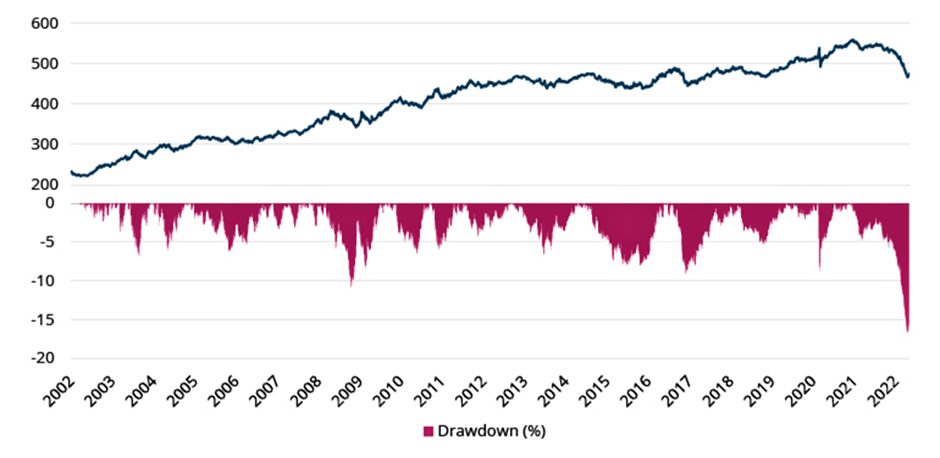
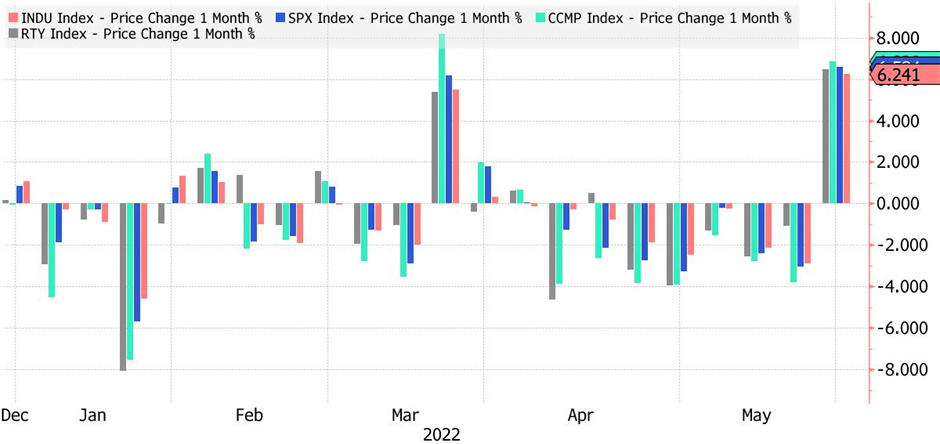
Stock markets sold off sharply in a three-day rout in late April and ended the month deep in the red. The US S&P 500 and Nasdaq led global equity markets downwards, with the former shedding 8.7% and the latter 13.3% in April alone. For the year, the Nasdaq has lost more than 21.1% and the S&P 500 12.9%.

China was also hard hit, extending its losing run that was set in motion last year when the Chinese authorities clamped down on tech and online industries, imposing much harsher regulations on their business activities. This year the world’s second largest economy has been dogged by ongoing Covid flareups, with Shanghai under strict lockdown during April and growing fears that Beijing may be next in line.

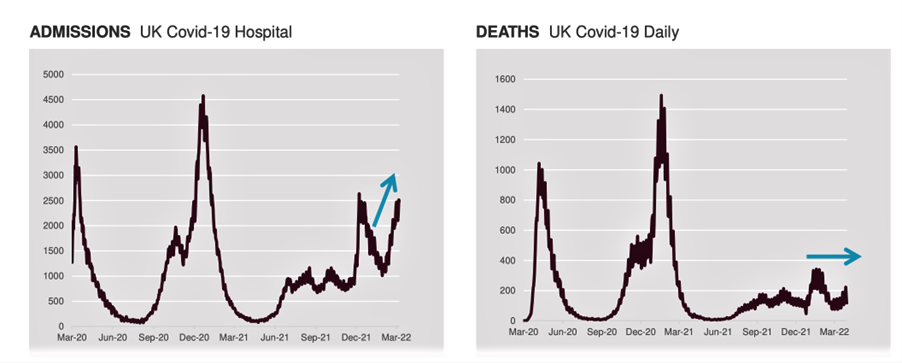
Elsewhere, Covid is proving less disruptive because even though numbers are rising, deaths are not and countries such as the UK are learning to live with the virus in the absence of a new more virulent strain emerging.

Vaccine policy keeping Covid fears muted
Flare-ups less likely but disruptions remain a wild card. Example: UK. Source: FTSE Russell.

Learning to live with inflation

The last several commentaries have identified inflation as the main driver of market movements since last year. In May, the bond markets had one their worst months ever, with yields jumping higher on concerns that the central banks may become overzealous in their implementation of more restrictive monetary policy conditions via higher interest rates and quantitative tightening. In both the US and Europe, indices of bonds with maturity greater than 10 years have declined in value by over 15% YTD.

With inflation at forty-year highs, the US Federal Reserve is still on track to raise the federal funds rate by at least 50 basis points at its next meeting. Moving forward, there is a growing argument that the Fed will take into account the potential for monetary conditions to tighten for other reasons, and that inflation is close to peaking.

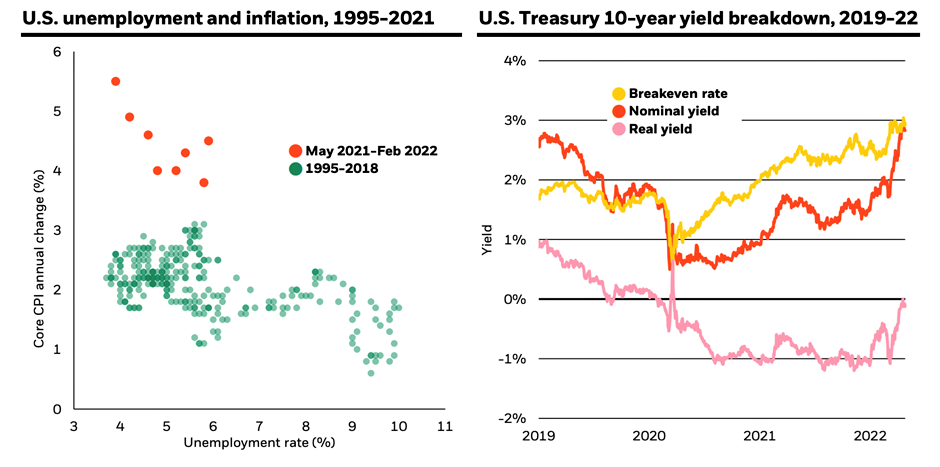
Global Outlook. Source: BlackRock.

BlackRock and FTSE Russell see the central banks as learning to live with inflation. Notwithstanding projections of a series of rate hikes this year, they believe the central banks are likely to maintain low real yields, cognisant of the risks of reversing their quantitative easing policy too sharply. Excessive tightening could destroy demand and lead to a rise in unemployment.

Despite the hawkish tone, central banks will be wary of raising rates too quickly.

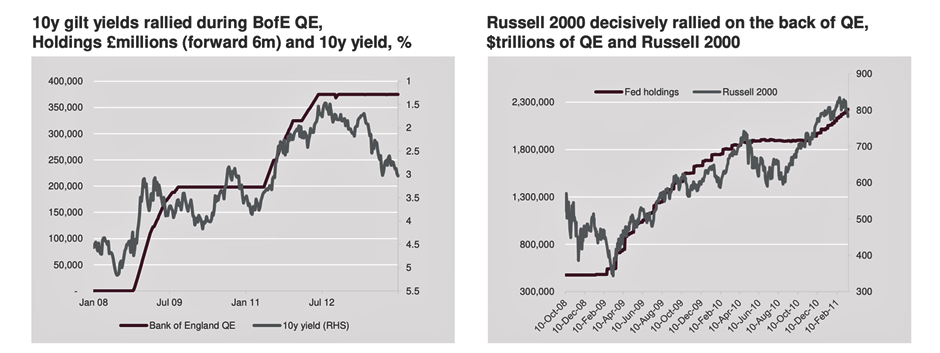
QE affected risk assets and rates positively
Central banks are highly aware of the positive effects that QE has brought and equally aware of the risks of reversing the policy. Source: FTSE Russell.

Downgrading growth forecasts

The IMF, the World Trade Organization and private sector economists are still factoring in a material slowdown in the global economy this year, downgrading their growth forecasts to reflect inflation, hawkish central banks, the ongoing Ukraine-Russia war and extended supply constraints, with China still set on maintaining its zero-Covid strategy.

The IMF downgraded its economic growth forecasts across 143 countries that account for 86% of global GDP, with global economic growth now expected to come in at 3.6% in both 2022 and 2023 – 0.8 ppt and 0.2 ppt lower than the growth projected in January this year.

The WTO is even more pessimistic, expecting world GDP to increase by a mere 2.8% this year and to pick up to 3.2% next year. The Peterson Institute for International Economics (PIIE) predicts that global economic growth will come in at 3.3% in both 2022 and 2023.

Clearly, recession is still not a base-case scenario but Europe is perhaps the region most vulnerable to this downside scenario. Despite the sharp deterioration in investor sentiment of late and material downgrades in growth forecasts, the world economy is still expected to avoid recession this year.

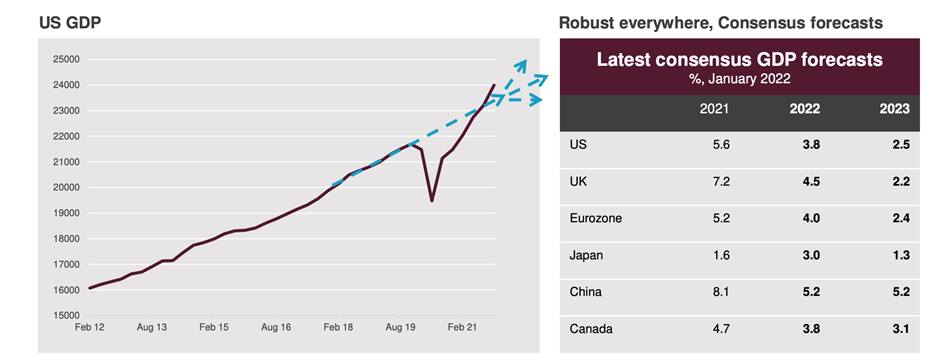
GDP growth and forecasts look robust next year
Optimistic backdrop: Rate-hike expectations have been fueled. Source: FTSE Russell.

U.S. elections loom on the horizon

Ahead for the US are the mid-term elections in November, which will inevitably affect the mood of the electorate. The prevailing view is that Republicans could well take back both chambers of Congress, which could result in policy gridlock.
Although markets tend to take such outcomes in their stride, it may increase volatility as policy differences become more apparent.

Republicans taking control of the House and the Senate is likely to result in fewer tax changes, greater increases in defence spending, fewer green initiatives and some contentious negotiations around the debt ceiling. That compares with the status quo, namely a moderate increase in defense spending, further climate bills aimed at putting in place green incentives and an easier path to raising the debt limit. We will doubtless see greater focus on the implications as the time nears.

Outlook

For opportunity seekers, April’s market volatility may prove to be a good thing. After years of being overlooked by investors who were seduced by handsome equity gains, the bond market may become attractive again as the yield on the 10-year Treasury note rose above 2.9% this month, notching more than 25% in gains.

As we are approaching the tail end of this economic cycle, some investor camp thinks it is not too early to be prepared for recessions by shifting to traditional defensive strategies. On the other hand, optimistic investors who still believe that the current bull market still have some legs may find hidden gems in the tech market, which is still reeling from rate hikes news and inflation.

We are currently adopting the wait-and-see dynamic in May. Additionally, by maintaining a small percentage of portfolios’ weight in cash (less than 10%), we may be flexible if attractive investment opportunities emerge for short-term plays.

The portfolios’ April performance is as followed:

Fund Name Performance
International Balanced -5.59%
International Growth -6.15%
Natural Resources -2.61%
Gold & Precious Metals -7.59%

Regards,

Euro Pacific Advisors Management Team

Margin Requirement — New Calculation: April 28, 2022

Effective 29 April 2022, Interactive Brokers1 will implement a new methodology to measure margin requirements for accounts holding a concentrated position in a low cap stock(s), including all holdings under the same issuer.

New Methodology

Currently, margin requirements for accounts holding a concentrated position in a low cap stock are determined using a proprietary Value at Risk (VAR) methodology, which calculates the theoretical worst-case loss of the position, given a range of price and implied volatility changes. The price scanning range for a given security is the greater of an individual portfolio’s concentration margin rate and the result of a stress test that simulates a price change reflective of a $500 million decrease in market capitalization.

The new methodology applies the same VAR framework, but Interactive Brokers will apply the greater of the individual concentration margin rate or low cap stress test to each asset.

For example, below are two assets held in a single account, issued by the same issuer with the same value, where the market capitalization of the issuer is $715 million.

  • Asset A: Concentration rate is 100%
  • Asset B: Concentration rate is 30%

Under the present calculation, the margin requirement for the portfolio would be based on the $500 million decrease in market capitalization, or approximately 70% of the market value of the 2 assets. Under the new concentration methodology, Asset A minimum price scan would remain at 100% and Asset B would increase to 70%, with an effective margin rate of 85%.

Recommended Actions

To evaluate the new change’s full impact on your portfolio and ensure the accounts remains margin compliant, please see KB Article 2957: Risk Navigator: Alternative Margin Calculator, and/or from the margin mode setting in Risk Navigator, select “MARGIN 20220429”.

Accounts that are unable to carry a position under this new margin requirement are subject to liquidations to bring the account into margin compliance. Therefore, please make necessary adjustments to your portfolio to comply with Interactive Brokers’ new policy.


1Euro Pacific Trader is offered by Euro Pacific Securities Inc. (“Euro Pacific Securities”), as an Introducing Broker to Interactive Brokers LLC. Interactive Brokers LLC is the custodian, technology provider, and clearing broker to all transactions executed through Euro Pacific Trader and thus the rates, conditions, and examples shown on this site may be subject to change and differ from what is displayed on Euro Pacific Trader. The rates, conditions, and examples on this site are provided on a best-efforts basis and should not be taken as final.

Euro Pacific Securities will not be held responsible for pricing and conditional discrepancies that may arise in the normal course of offering Euro Pacific Trader. Customers should always review and rely on the conditions that are shown directly on Euro Pacific Trader, and it is the responsibility of all customers to carefully review the conditions of every action before approving execution on Euro Pacific Trader.

Interactive Brokers LLC is a registered Broker-Dealer, Futures Commission Merchant and Forex Dealer Member, regulated by the U.S. Securities and Exchange Commission (SEC), the Commodity Futures Trading Commission (CFTC) and the National Futures Association (NFA), and is a member of the Financial Industry Regulatory Authority (FINRA) and several other self-regulatory organizations. Interactive Brokers LLC does not endorse or recommend any introducing brokers, third-party financial advisors or hedge funds, including Euro Pacific Securities. Interactive Brokers LLC provides execution and clearing services to customers. None of the information contained herein constitutes a recommendation, offer, or solicitation of an offer by Interactive Brokers LLC to buy, sell or hold any security, financial product or instrument or to engage in any specific investment strategy. Interactive Brokers LLC makes no representation, and assumes no liability to the accuracy or completeness of the information provided on this website.

For more information regarding Interactive Brokers, please visit www.interactivebrokers.com.

Portfolio Commentary: Ukraine, Inflation Dominated Market Sentiment

Published: April 11, 2022

euro pacific advisors fund manager portfolio 
commentary

Relevant Strategies

  • International Balanced
  • International Growth
  • Natural Resources
  • Gold and Precious Metals
  • Peter Schiff

Our Commentary

Market overview

Although stock markets improved during March, most remain lower year-to-date with some European markets and global growth sectors registering double-digit percentage declines. The only major developed stock market to be in the black year-to-date is the FTSE 100 which is registering a 2.9% increase. In contrast, the UK mid-cap index is 9.4% lower and the MSCI Europe (Ex UK) index has declined by 7.8%, having been particularly affected by the war and the impact of reduced access to energy supplies.

Despite the increasingly confrontational political rhetoric into the new year, only a minority of investors really believed a Russian invasion of Ukraine was imminent and the shock move raised the specter of World War III, a worst-case scenario that is not yet out of the question. In recent days, stock markets have found new optimism in any signs that talks between the two countries may result in a ceasefire. News that Russia would “retreat” from armed conflict in Kyiv and focus on the eastern territories saw stock markets rally into the final days of the quarter.

Commodities soar

In response to the Ukraine crisis, commodity prices have soared, with oil reaching $130 a barrel and prompting predictions it could reach as high as $200. Natural gas also rose further as the world came to grips with just how dependent Europe is on the gas supplied by Russia, as evidenced by the fact that the stringent and far-reaching sanctions imposed on Russia excluded energy commodities.

Peace talk hopes weigh on oil prices. Source: Refinitiv.

The biggest surprise was the surge in nickel prices to $100,000 a ton and a halt in trading due to the unprecedented short squeeze, highlighting the dislocations that can occur when geopolitical shocks emerge.

Nickel surges to $100,000/ton in historic short squeeze. Source: LME.

The war has also wrought havoc in the grain and fertilizer markets that could have long-standing impacts, including dire food shortages in low-income countries. Already producers are raising prices or seeking to reduce their use of these inputs in response to the restricted supply and steep price increases. Reductions in fertilizer usage in the upcoming planting seasons could see yields decline and so the vicious cycle of scarcity could intensify.

The war on inflation

In the last commentary, inflation is one of the main concerns derived from the Conflict’s escalation. Overshadowed by inflation fears, food and energy price now likely to spiral off already 40-year US inflation highs. The graph below highlights how economists are ratcheting up their inflation forecasts for the OECD countries – to 5.1% currently from the 1.5% expected this year when economists made their predictions in early 2021.

Inflation estimates for major OECD nations. Source: RBC Global Asset Management.

The sharp turnaround from what the Fed expected to be transitory inflation last year to the potential for a return to 1970s inflation highs has resulted in far more hawkish central bank stances in the first quarter of this year. The Fed’s March meeting saw interest rate projections catch up with the more hawkish expectations of the market. The graph below shows a significant shift upwards in the implied Fed funds rate as measured in 12-month future contracts, with consensus expectations now for at least six rate hikes this year and three next. The prospect of a couple of outsized 50-basis point increases is now being factored in, with US central bank messaging paving the way for one at the next meeting.

Implied fed funds rate – 12 months futures contracts. Source: RBC Global Asset Management.

Such an aggressive response to inflation pressures arising out of the pandemic – and now accentuated by the war – has also raised growing concerns that rate hikes will stall the world economy or even drive certain regions into recession, reintroducing the stagflation that haunted the world in the 1970s.

These fears increased in the final week of the quarter as the two-to-10-year area of the US yield curve inverted. History indicates such an inversion (i.e. longer dated yields being lower than shorter dated) is a harbinger of recession. However, opinion is divided on whether this will prove the case on this occasion and how long after the inversion a recession may occur, with many economists saying it could be as much as 18 months to two years ahead. Some economists also suggest that, given the historic levels of monetary accommodation and liquidity introduced into the financial markets, the relationship between an inverted yield curve and economic recession is less reliable than it once was.

Yield curve inversions and recessions. Source: Refinitiv Datastream.

No matter the outcome, the central banks still face the unenviable position of having to prevent expectations of higher prices from setting in while avoiding an economic meltdown. For now, all indications are that the developed economies, particularly the US, are as robust as they were coming into 2022. The latest purchasing manager indices, as shown in the graph below, show that only China’s PMI fell below the 50 level into contraction territory. The US and Europe manufacturing PMIs remain well above that level.

Global purchasing managers’ indices. Source: RBC Global Asset Management.

China’s challenges

After leading the world out of the initial phase of the pandemic, China now faces a host of challenges which have seen its economy and stock market performance diverge from the rest of the world. The Chinese government’s focus has been on trying to repair the damage it did to investor certainty after clamping down on tech and online education companies last year. This comes at a time when it is up against a resurgence of Covid infections. Nonetheless, the government is still confident that it will achieve the above 5.5% growth target (see graph below) that it set for the country and, after providing stimulus to the market, has shown an intention to do what it needs to do to get there.

China targets around 5.5% growth – The economy has never missed its target. Sources: Government work reports; National economic and social development reports; National Bureau of Statistics.

Outlook

The Russia/Ukraine geopolitical shock has brought increased uncertainty to stock markets. However, history has shown the dangers of making negative long-term judgements based on short-term concerns. The graph below shows how the US stock market at least has continued to climb notwithstanding the extremely volatile conditions at times since 2013.

Sources: Fred.stlouisfed.org; Chicago Board Options Exchange; S&P Dow Jones Indices LLC.

Stock markets recover and rally after macro-economic or geopolitical shocks, and it is during these periods that the best investment opportunities often arise.

US consensus earnings expectations for the S&P500 have moderated from their exceptional levels last year, but they remain positive, as shown in the graph below. This plots the month-by-month progression of S&P 500 earnings estimates, which have been moving sideways for the past few months. While the war in Europe continues to devastate the lives of millions, there are nonetheless many companies across the world for which the financial impact is minimal and many others that offer the potential for a significant rebound following indiscriminate selling.

Consensus US earnings estimates. Source: RBC Global Asset Management.

The portfolios’ March performance is as followed:

Fund Name Performance
International Balanced 1.51%
International Growth 2.36%
Natural Resources 8.16%
Gold & Precious Metals 7.21%

Regards,

Euro Pacific Advisors Management Team

Portfolio Commentary: Effects of Ukraine Crisis

Published: March 07, 2022

euro pacific advisors fund manager portfolio 
commentary

Relevant Strategies

  • International Balanced
  • International Growth
  • Natural Resources
  • Gold and Precious Metals
  • Peter Schiff

Our Commentary

Market overview

The anticipation of Russia invading Ukraine knocked stock markets down in February. Share indices fell between 4% and 8% in the days leading up to the invasion on February 24, but then recovered as the initial sanctions announced were seen as being less detrimental to markets than had been feared.

The NASDAQ was the hardest hit, slumping 7.7% in the days ahead of the invasion and standing 14% lower this year. Many European indices are also showing double digit declines, the exception being the FTSE 100 Index which is broadly level. There are increasingly attractive opportunities in European equities with valuations now so low that the risk/reward profile is better than at any time since the financial crisis of 2008.

S&P 500: Since the beginning of the coronavirus pandemic. Source: New York Times.

As expected, Russian assets and the ruble were hard hit by Putin’s decision to go to war, with the ruble-denominated stock market index shedding 54% in the first two hours of trading on the news of the invasion. This time the impact on the Russian financial market and economy is likely to be a far cry from Russia’s annexation of Crimea in 2014 when, after an immediate decline, the stock market went on to rally for the following nine years.

MOEX Russia Index Performance. Source: Refinitiv, FactSet.

The price of Brent crude oil reacted strongly to the crisis, pushing through the $100 a barrel to $105. Dutch TTF Gas Futures prices also soared 70% in the immediate aftermath of the invasion, given Europe’s reliance on Russian gas supplies.

The war and inflation

The conflict is expected to lift global inflation even further through its impact on a large part of the world’s broader commodity and agriculture complex. Russia is a one of the world’s largest oil producers and gains from gold, inflation-linked bonds and global property are partially offsetting declines in equity markets.

CPI forecasts under various scenarios for oil prices. Source: Bloomberg Economics.

The Russia-Ukraine war ousted the US interest rate hiking cycle as the core theme driving financial market sentiment for most of February. However, investors continued to speculate on the future trajectory of interest rates, now factoring in the possible impact of the hostilities in the short term. While markets had begun to price in an aggressive 50-basis point increase in the Federal Reserve fund rate in March, with up to seven rate hikes thereafter, Fed officials have talked down the prospect of a heavy hitting initial rate hike and the market is now pricing in a total of seven rate hikes this year.

Opinion is divided over whether the war will lock in inflation rates at their current highs due to the domino effect higher commodity prices and supply disruptions will have on prices in general. In the last week of the month, the Fed’s preferred gauge of inflation, core PCE, came in slightly ahead of expectations, at 5.2% versus 5.1% but the broad headline rate of 6.1% is a long way ahead of the Fed’s target for average inflation of 2%. The Bloomberg graph below highlights how the US inflation peak could be delayed based on rising oil prices, with CPI forecast to exceed 8% if oil reaches $120 a barrel and to hit around 8% if it remains between $90 and $95 a barrel.

Markets are not at this stage anticipating inflation rates to stay high for the long-term. The price of inflation-linked bonds and derivative contracts in the US reflect the belief that inflation will average 2.5% for the next decade.

Implications of Ukraine crisis

One of the main implications of the Russian assault on Ukraine is expected to be a marked increase in defense spending across the world, which would reverse the steady decline in defense spending as a percentage of GDP globally since the mid-1980s. The implications of such an increase would be that governments would need to re-route expenditure away from social security and infrastructure spending at a cost to the average civilian.

While it is too early to tell whether Russia will achieve its aim of taking over Ukraine, Vladimir Putin’s decision to walk away from diplomatic solutions is expected to alter the geopolitical landscape for the worse in the long term.

Russia and China have been moving away from a reliance on the dollar, with the proportion of trade payments in dollars between the two now only 16% versus 97% in 2014. Russia now has more of its reserves in gold than in dollars.

Developed world countries have introduced stiff sanctions on Russia, Putin, his foreign secretary and the oligarchs in the wake of the invasion. These range from trade sanctions, travel bans, freezing the assets of the wealthy and, most recently, removing most of the country’s access to the SWIFT payment system and freezing the foreign reserves it holds overseas. However, these are not likely to have an immediate impact on the country and some of them are extremely difficult to implement, particularly with regards to sanctions on Russian individuals’ assets.

The dollar-denominated RTS Index following Russian invasion. Source: Refinitiv, FT research.

Of most concern is Europe’s huge reliance on gas supplies from Russia – a situation that is not going to change in the short to medium term. The region has invested heavily in renewable energy sources but is probably decades away from becoming self-reliant on green energy sources. Germany has nonetheless officially halted certification of the Nordstream 2 pipeline, which has been the subject of ongoing negotiation between Russia and Europe.

As a result, Russia has been spared sanctions on energy supplies, which alleviated the impact on the stock market as seen in the dollar-based RTS index of liquid Russian shares in the graph above.

Outlook

Since our exposure to the Russian market is negligible, we are not concerned about its performance in the short and medium term. However, it’s essential to address the potential impacts of the conflict on important factors like inflation and the global economy.

Bloomberg has mapped out different economic scenarios going from bad to worse as a result of the Ukraine crisis.

Scenarios for economic impact of Ukraine crisis. Source: Bloomberg Economics.

Initial indications would suggest the first is unfolding, with Russian oil and gas still available and markets on the up off after their steep sell off. In this event, the Fed is seen as likely to engage in a milder monetary policy tightening regime than currently priced into markets.

Lastly, a scenario in which Europeans are denied access to Russian gas and the world to its oil could well trigger the stagflation outcomes that have been the subject of so much debate during the pandemic. Inflation would become even more of a problem and central bank action would stall growth, perhaps resulting in a hard landing for the global economy.

The portfolios’ February performance is as followed:

Fund Name Performance
International Balanced -0.38%
International Growth 0.10%
Natural Resources 2.74%
Gold & Precious Metals 11.09%

Regards,

Euro Pacific Advisors Management Team

New Update: Russia-Ukraine Conflict

Responding to the new development of the Russia-Ukraine conflict and its impacts on the markets in the last 24 hours, Interactive Brokers will implement a new maintenance margin requirement as followed:

All ADR/GDR and ETF instruments with Russian securities as underlying(s) will have the maintenance margin requirement of 100%, effective immediately.

The new maintenance margin requirement will be maintained until further notice.

We strongly recommend that accounts with exposure to mentioned securities to take the necessary steps to ensure margin compliance. Accounts that are not margin compliant are subject to immediate and automated liquidation by Interactive Brokers.


1Euro Pacific Trader is offered by Euro Pacific Securities Inc. (“Euro Pacific Securities”), as an Introducing Broker to Interactive Brokers LLC. Interactive Brokers LLC is the custodian, technology provider, and clearing broker to all transactions executed through Euro Pacific Trader and thus the rates, conditions, and examples shown on this site may be subject to change and differ from what is displayed on Euro Pacific Trader. The rates, conditions, and examples on this site are provided on a best-efforts basis and should not be taken as final.

Euro Pacific Securities will not be held responsible for pricing and conditional discrepancies that may arise in the normal course of offering Euro Pacific Trader. Customers should always review and rely on the conditions that are shown directly on Euro Pacific Trader, and it is the responsibility of all customers to carefully review the conditions of every action before approving execution on Euro Pacific Trader.

Interactive Brokers LLC is a registered Broker-Dealer, Futures Commission Merchant and Forex Dealer Member, regulated by the U.S. Securities and Exchange Commission (SEC), the Commodity Futures Trading Commission (CFTC) and the National Futures Association (NFA), and is a member of the Financial Industry Regulatory Authority (FINRA) and several other self-regulatory organizations. Interactive Brokers LLC does not endorse or recommend any introducing brokers, third-party financial advisors or hedge funds, including Euro Pacific Securities. Interactive Brokers LLC provides execution and clearing services to customers. None of the information contained herein constitutes a recommendation, offer, or solicitation of an offer by Interactive Brokers LLC to buy, sell or hold any security, financial product or instrument or to engage in any specific investment strategy. Interactive Brokers LLC makes no representation, and assumes no liability to the accuracy or completeness of the information provided on this website.

For more information regarding Interactive Brokers, please visit www.interactivebrokers.com.

Update: Russia-Ukraine Conflict

In light of the recent geopolitical tensions associated with Russia and to address any associated increased volatility, Interactive Brokers will be implementing an increase in the margin requirements for Russian equity products (stocks, ETFs and/or equity options).

Updated Margins

Trading accounts holding Russian products should expect long and short maintenance margin to be increased to the following levels:

Affected Products Long Maintenance Margin Short Maintenance Margin
Russian ETFs/ETPs 25% 25%
Russian Stocks 25% 50%

Timeline of Change

The increase will be phased in over a series of daily increments in the period starting from the New York close on February 24. The new temporary margin levels will be maintained until February 28.

Recommended Actions

We strongly recommend that accounts with exposure to mentioned Russian securities to take the necessary steps to ensure margin compliance throughout the implementation schedule. Accounts that are not margin compliant are subject to immediate and automated liquidation by Interactive Brokers.


1Euro Pacific Trader is offered by Euro Pacific Securities Inc. (“Euro Pacific Securities”), as an Introducing Broker to Interactive Brokers LLC. Interactive Brokers LLC is the custodian, technology provider, and clearing broker to all transactions executed through Euro Pacific Trader and thus the rates, conditions, and examples shown on this site may be subject to change and differ from what is displayed on Euro Pacific Trader. The rates, conditions, and examples on this site are provided on a best-efforts basis and should not be taken as final.

Euro Pacific Securities will not be held responsible for pricing and conditional discrepancies that may arise in the normal course of offering Euro Pacific Trader. Customers should always review and rely on the conditions that are shown directly on Euro Pacific Trader, and it is the responsibility of all customers to carefully review the conditions of every action before approving execution on Euro Pacific Trader.

Interactive Brokers LLC is a registered Broker-Dealer, Futures Commission Merchant and Forex Dealer Member, regulated by the U.S. Securities and Exchange Commission (SEC), the Commodity Futures Trading Commission (CFTC) and the National Futures Association (NFA), and is a member of the Financial Industry Regulatory Authority (FINRA) and several other self-regulatory organizations. Interactive Brokers LLC does not endorse or recommend any introducing brokers, third-party financial advisors or hedge funds, including Euro Pacific Securities. Interactive Brokers LLC provides execution and clearing services to customers. None of the information contained herein constitutes a recommendation, offer, or solicitation of an offer by Interactive Brokers LLC to buy, sell or hold any security, financial product or instrument or to engage in any specific investment strategy. Interactive Brokers LLC makes no representation, and assumes no liability to the accuracy or completeness of the information provided on this website.

For more information regarding Interactive Brokers, please visit www.interactivebrokers.com.

WARNING AGAISNT Universal Trust Bank Inc

Published 19-FEB-2022

It has been drawn to our attention that a scam website, https://banking.utrusb.com/en-us/index.html, operating under the name Universal Trust Bank Inc., has been created without our consent and has unlawfully copied our website content including our name and logo in an effort to impersonate us.

We can confirm the details below are fake and are in no way connected to Euro Pacific Bank.

  • Name: Universal Trust Bank Inc
  • Tel: +44 7418 320753
  • Email: [email protected]
  • Address: 28 Baker St, Marylebone, London W1U, United Kingdom
  • https://banking.utrusb.com/en-us/index.html

Please immediately report as spam and delete any emails or communications referencing this site, as the intention is likely to steal your login credentials or personal information and/or to help perpetrate an advance-fee scam or similar financial related scams.

Portfolio Commentary: Favorable outlook after rocked markets

Published: February 08, 2022

euro pacific advisors fund manager portfolio 
commentary

Relevant Strategies

  • International Balanced
  • International Growth
  • Natural Resources
  • Gold and Precious Metals
  • Peter Schiff

Our Commentary

Market overview

It has been a rough start for the year. Geopolitical tensions between the US and Russia have become increasingly acute, but it is nervous anticipation of the US Federal Reserve withdrawing monetary policy support that has been the main cause of a spike in financial market volatility.

The world’s so-called fear gauge, the CBOE VIX, climbed to last January’s high of 33 during the month but remains much lower than its peak of 66 when the market experienced its COVID 19-related bear market crash in March 2020.

CBOE VIX index. Source: CNBC.

After a bumpy 2021, stock markets ended the new year’s first month in the red. The NASDAQ index was 15% lower at one point, on a rotation from the growth stocks that form most of the index into value stocks. The S&P 500 ended down 5%, China’s SSE Composite was down by 6% and the Japan Nikkei 225 by 7%. The UK FTSE 100 Index was one of the few developed markets not to end lower but the mid-cap index was down by 7%.

Bond prices also suffered and the price of long-dated indices registered declines of up to 7%. Within the typical portfolio, bond exposure has been reduced and is generally short-dated and/or inflation-linked to minimize interest rate sensitivity, increasing other risk factors to generate returns.

The gold price has remained steady while the index of a broad basket of commodities added a further 9% as the oil price soared.

Rate hikes question

The jury is still out as to how many interests rate rise we can expect from the Fed this year, but the number implied by derivative markets has increased steadily from two last year to three and then four. After the first Fed meeting, investors envisage a scenario in which there are five successive rate hikes, coming at each Fed meeting from March.

At the first meeting of the year, Federal Reserve Chair Jerome Powell was careful to emphasise that there was no preset course for rate hikes this year and that the Fed would respond nimbly, “led by the incoming data and the evolving outlook.”

What is clear is that the Fed doesn’t want a repeat of the 2013 taper tantrum. It is going to tread carefully so as not to derail financial markets or the global economic recovery by moving too fast – the outcome financial markets are most jittery about at the outset of 2022.

Rotation from growth stocks into the COVID laggards

Rising interest rates are seen as favoring stocks that offer value based on their net assets over those exhibiting strong growth. This is because many investors and analysts use net-present-value models to value stocks. The rationale is that growth stocks look less attractive on this measure when interest rates rise because their expected earnings are in the distant future and therefore worth less. In this scenario, higher inflation is positive for value strategies because growth companies may benefit less from price hikes, while value companies that have actual earnings can boost profit margins by raising prices.

However, rising interest rates have not been shown to have a long-term effect on equity prices, arguably because a higher discount rate is counter-balanced by a stronger growth rate in cash flows. There is no historical correlation between rate rises and equity market performance and there have been many periods of buoyant stock markets with rising rates. Investors seem nervous now because many have only ever witnessed low rates and strong returns.

Will value stocks continue to outperform growth stocks in this cycle? Source: YCharts.

Outlook

Interest rates will rise as quickly as expected if inflation remains sticky – a situation that will depend on whether:

  • Demand continues to rise unabated
  • Supply constraints remain an ongoing challenge
  • Labour costs continue increasing, setting in motion a wage-price spiral that poses great risk to inflation expectations

We anticipate further volatility in growth stocks in the short term, but the trends accelerated by COVID remain very much in place and when the dust settles there will certainly be opportunities.

Financial markets and the real economy don’t always move in tandem. It is likely 2022 will continue to produce volatile markets as investors fret about whether central banks will remove stimulus too slowly or too quickly, whether inflation will remain too high or fall quickly towards deflation, and whether China will be able to reach an economic glide path without too much turbulence.

Additionally, we think investors may have underestimated the earnings power of many companies who have responded to COVID and supply disruptions with improved delivery of their products and services. Decent profit growth and undemanding valuations in many areas should enable swathes of the equity market to produce positive total returns. Furthermore, many consumers are sitting on piles of cash from fiscal stimulus and capital expenditure, and this factor may fuel further economic and investment activities in the short and medium term.

The portfolios’ January performance is as followed:

Fund Name Performance
International Balanced -4.67%
International Growth -5.49%
Natural Resources 2.34%
Gold & Precious Metals -1.62%

Regards,

Euro Pacific Advisors Management Team

Portfolio Commentary: Strong year for equities ends with gains

Published: January 14, 2022

euro pacific advisors fund manager portfolio 
commentary

Relevant Strategies

  • International Balanced
  • International Growth
  • Natural Resources
  • Gold and Precious Metals
  • Peter Schiff

Our Commentary

Market overview

Most stock markets gained ground in December to wrap up a year, in which equities went from strength to strength while bonds and gold lost value. The S&P 500 rallied a staggering 27% during the year, European and UK market gained over 15% while China was the standout underperformer, sliding 5% after Chinese regulatory clampdowns raised investor concerns about the world’s second largest economy.

Stimulus and vaccines have sent stocks to record highs. Source: Source: Refinitiv Datastream.

US companies had strong third quarter earnings and the fourth quarter is expected to be equally impressive. Earnings growth for the year is expected to be 45%, significantly greater than the 22% growth anticipated a year ago. However, with the S&P500 price to earnings ratio at 28.9, the jury is out on whether similar increases can be achieved this year.

The sectors that outperformed in 2021 were energy – which had a runaway streak from mid-September – financials, real estate and information technology. According to Bank of America, about 65% of the Nasdaq’s gains can be attributed to five tech stocks – Microsoft, Google, Apple, Nvidia and Tesla.

S&P 500 sectors performance. Source: Standard & Poor’s.

Macroeconomic concerns remain

The stellar stock market increases occurred against an uncertain macroeconomic picture, which has faced global supply challenges, rising inflation and central bank moves to start withdrawing trillions of dollars of liquidity that have been propping up the financial markets and buoying investor sentiment.

A significant rise in consumer demand for goods, Covid-related bottlenecks caused by port shutdowns in China and other logistical hiccups led to supply constraints which fed rising prices. These also saw microchips in short supply, with the impact felt across the manufacturing sector and auto companies the hardest hit.

Inflation took over as public enemy number one after initial hopes that supply would catch up with demand after a few months. Considered transitory by most mainstream economists and the Federal Reserve for most of the year, US Federal Reserve Chairman Jerome Powell formally put the term out to pasture in early December, acknowledging that inflation was likely to remain higher for longer.

As a result, the Federal Reserve is increasing the pace of its monetary policy tightening to ensure inflation expectations don’t become entrenched and set in motion a self-fulfilling cycle. The central bank began tapering in November and now expects the process to be over earlier than its original June target date. Chairman Powell also indicated that financial markets could expect up to three rate hikes in 2022.

Global inflation surged in 2021 . Source: Refinitiv Datastream.

In the UK, the Governor of the Bank of England guided the financial markets to expect a rate hike in November but did not deliver, causing significant bond market volatility. Interest rates were raised in December. The European Central Bank remains more dovish.

Central banks will have to maintain the delicate balance between keeping inflation expectations anchored and allowing for a supportive environment for economic growth. As negative supply shocks push inflation higher, they threaten to set off a self-fulfilling cycle of ever higher inflation, which could begin to chip away at demand.

While the global economic recovery continued, the World Bank raised concerns about the uneven rates of recovery, as shown in the graph below. High income countries have managed to recover at a healthy rate and are expected to continue on their upward trajectory. In contrast, low income countries have lagged.

Global economic recovery is expected to be uneven. Source: Global Economic Prospects, 06/2021.

The OECD expects a rebound in global economic growth to 5.6% this year and 4.5% in 2022, before settling back to 3.2% in 2023, close to the rates seen prior to the pandemic.

Omicron’s appearance in December raised economic concerns but hopes that that measures to limit the spread may be more restrained than for previous variants meant financial markets recovered ground and the oil price, which came off $10 a barrel on the day Omicron hit the news, recovered rapidly.

Gas prices rise due to shortages

Since Autumn, gas prices have spiraled in response to global supply shortages. Record high natural gas prices in Europe and Asia were spurred by significant demand ahead of the northern hemisphere winter and unanticipated shortfalls in existing renewable energy production. They were also affected by the geopolitical forces stemming from what is seen as Russia’s attempt to force Europe’s hand by restricting supplies so that it will approve the Nord Stream 2 gas pipeline.

Europe relies significantly on natural gas from Russia and now has to compete with South East Asia for liquid natural gas exports from the US, where there is pressure to halt exports. Most economies, including China, are likely to transition to gas in their journey to becoming net-zero economies and thus demand is only likely to intensify over the next decade.

Energy prices and food prices have risen sharply since the COVID-19 pandemic begins. Source: World Bank Commodity Market Outlook. Note: Data for 2021 and 2022 are forecasted.

Portfolio Actions

Despite December gains, we think markets will be under pressure going to the first quarter of 2022. A few media camps have discussed about the possibility of a market correction in January. We think the possibility of such event’s occurrence is low.

The portfolios’ composition remains unchanged for the month, while we are currently maintaining a comfortable degree of cash in all portfolios (<10%) in case investment opportunities arise. Our December and annual performance are as followed:

Fund Name Performance (December) Annual Return
International Balanced 1.74% 0.62%
International Growth 2.19% 3.83%
Natural Resources 1.42% -0.19%
Gold & Precious Metals 2.06% 20.80%

Regards,

Euro Pacific Advisors Management Team

LAST UPDATED: OCTOBER 31, 2024

October 31, 2024: Receiver's Report.

October 16, 2024: Receiver's Notice.

October 04, 2024: Migration Update.

April 16, 2024: Receiver's Reports.

April 13, 2024: Migration & Liquidation update.

March 11, 2024: Receiver's Reports.

March 03, 2024: Migration & Liquidation update.

February 19, 2024: Migration & Liquidation update.

February 02, 2024: Migration & Liquidation update.

November 21, 2023: Migration Update (Opt-in Only).

November 20, 2023: Progress Report (Opt-out Only).

September 22, 2023: Report & Communication Portal.

September 01, 2023: Migration & Liquidation update.

July 20, 2023: Migration & Liquidation update.

June 23, 2023: Migration & Liquidation update.

June 17, 2023: Receiver's report.

May 31, 2023: Migration & Liquidation update.

May 05, 2023: Migration & Liquidation update.

April 20, 2023: Liquidation update- Action required.

March 31, 2023: Migration & Liquidation update.

March 8, 2023: Migration & Liquidation update.

January 27, 2023: Correspondent bank update.

December 16, 2022: Comprehensive FAQ is published.

December 05, 2022: Migration & liquidation update.

November 01, 2022: Mutual funds & outgoing wire requests update.

October 21, 2022: Update on Opt-out deadline - Extended.

October 14, 2022: Customer Update & Townhall.

October 8, 2022: Update on opt-out deadline for EPB clients who do not wish to migrate their account to Qenta Inc.

September 30, 2022: Update on bank liquidation, pending transactions, and migration of assets to Qenta Inc.

September 28, 2022: Update on pending transactions for clients opting out of Qenta Inc. migration.

September 16, 2022: Update on pending transactions for clients opting out of Qenta Inc. migration.

September 8, 2022: Qenta has emailed a welcome letter to all EPB clients. You can read a copy of it here.

September 2, 2022: Update on pending transactions, brokerage, and account migration.

August 29, 2022: Euro Pacific Bank liquidation has commenced. Please read our formal instructions here as it is time-sensitive.