The continued escalation of trade tensions between the US and China led to a further flight to the relative safety of the US dollar and depressed asset prices throughout the rest of the world. This was most apparent in declines of overseas currencies and investors punished those where there are large current account deficits and a reliance on overseas sources of funding. Investment returns have been mixed and the dispersion of returns in the second quarter an ongoing theme.
Europe has confirmed that it will end its Quantitative Easing program by the end of the year, although interest rates are not likely to climb until next year. UK interest rates were increased to 0.75%, the first hike of 2018, but no further move is expected until after Brexit. There are no signs that Japan is ready to end its Quantitative Easing program and it recently expanded the range of equities eligible for purchase.
Economic data have been mixed. The US has continued to outperform other regions. Whilst growth picked up in the UK and Japan, there remain some doubts about its sustainability in these countries. Leading indicators in China point towards lower GDP growth. There remains a risk of US tariffs rising to 25% on the full range of US – Chinese imports with the most pessimistic forecasts suggesting a 15% yuan devaluation and China’s current account going into deficit. Meanwhile in Europe, the economy remains relatively solid, although political issues still linger.
Equities
The US equity markets outperformed again. This came despite the US Federal Reserve raising interest rates again and the market is now becoming more confident in their outlook for higher rates over the next year.
UK markets posted negative total returns over the quarter and the FTSE 100 lost -0.7% with the more domestic based FTSE 250 down -1.8%. The US made the best overall returns in global equity markets, the S&P 500 making a total return of +8.9% when converted to sterling. Eurozone indices and broad based emerging market indices were roughly unchanged.
Fixed Income
Government bond markets struggled as investors priced in the prospects for additional rate hikes, particularly in the US. Conventional Gilts made a total return of -2.0% with Index Linked Gilts down -1.4%. The only gains to be had were in High Yield which gained +1.9% and Strategic Bonds up +0.4%. Corporate Bonds were little changed, down -0.2%.
Gold
Gold fell by -4.4% in dollar terms over the quarter. The precious metal tends to struggle in an environment of rising real interest rates, although it remains valuable as a hedge within portfolios.
The ‘turn’ effect is a phenomenon that exists in financial markets which is caused by supply and demand for funding over key dates such as year or quarter-end. This can create anomalies in the forward curves for certain currencies, and we are already beginning to see this priced into the year-end swap points that we receive from our liquidity providers.
Swap points are a key component of the FX Value Date Rollover which is used to adjust the opening price of a position[1], and therefore if you hold a FX spot position over year-end you may bear the cost of paying these inflated swap points[2], when compared to normal market conditions.
For more information on the FX Value Date Rollover, please contact Sales & Trading at [email protected].
[1] Applicable to the default rollover methodology
[2] Depending on the currency pair and your positioning (long/short)
Market data subscription fees will change from 1 January 2019 for a number of exchanges and news services.
To view the updated subscription fees, please log into your Global TradeStation (GTS) platform from January 1, 2019, view the Account tab, and click Subscriptions.
Note: Not all listed exchanges and services are supported on Global TradeStation (GTS). Please contact Sales & Trading at [email protected] for clarification.
We are pleased to announce an improvement to our corporate actions process. Stock premiums (share premium dividends and capital gain distributions) will be paid on the actual pay date rather than ex-date.
For clients having instruments with both an initial and maintenance margin, the account summary will soon be enhanced with additional information to clarify your available initial and maintenance margin status.
This will include:
Initial margin reserved – the overall initial margin required for your open positions
Initial margin available – the margin available for opening new positions
Maintenance margin reserved – the overall maintenance margin required for your open positions
Maintenance margin available – the margin available for maintaining current positions
This information will be shown in the account details for the selected account(s) available from:
The account summary toolbar in Global TradeStation (GTS)
The account summary panel in Global TradeStation (GTS)
To create a buffer between your available trading collateral and the margin close-out level (which ESMA recently standardised), we apply two margin requirements:
Initial margin
Initial margin is a pre-trade margin check on trades and orders where you must have sufficient initial margin collateral available to meet the initial margin requirement.
Note that initial margin is cumulative and not just an initial check when placing a trade; you must continue to cover the initial margin for all existing trades (shown by Initial margin reserved) before you can place new trades (shown by the initial margin available).
Maintenance margin
Maintenance margin is a continuous margin check, that you have sufficient margin collateral on your accounts to maintain your open positions. Maintenance margin is used to calculate your margin utilization.
Trading Conditions
The current margin requirements for a margin instrument can always be seen in the trading platforms in the trading conditions for the instrument.
A number of improvements have recently been released to the chart in the Global TradeStation (GTS) platform:
Share annotations across time periods
New chart study – Williams Acceleration/Deceleration Oscillator (WAC)
Chart default settings (from last month)
Share annotations across time periods
A new option in the chart configuration menu, Share Annotations across all time periods (selected by default).
When selected, annotations you apply to a chart will be shared across all time periods for the instrument. For example, if you draw a trend line on a 60-minute chart, it will also be shown on all other time periods 15 min, 4 hours, daily and so on.
Share Annotations across all time periods is on (checked) by default but can be disabled in the Chart configuration (right-click > Chart configuration).
New chart study – Williams Acceleration/Deceleration Oscillator (WAC)
The new Williams Acceleration/ Deceleration Oscillator (WAC) indicator is now available in Global TradeStation (GTS) from the indicator menu.
The WAC indicator measures the acceleration and deceleration of the current direction and will change direction before the price changes acting as a warning signal for changes in price direction.
The oscillator is a histogram that fluctuates around a zero line where there is balance. When the oscillator is above the zero line and the histogram is green, there is higher likelihood that a rising trend will continue and when red below the line higher likelihood for a downtrend to continue.
Users of this indicator watch for changes in the histogram colour and not when the histogram crosses the zero line. When the histogram changes from red to green it can indicate a buy signal and vice versa.
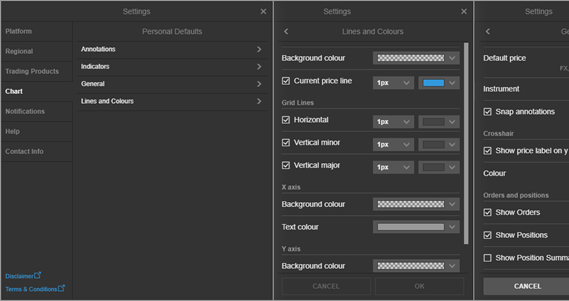
Chart default settings (announced last month)
The chart in Global TradeStation (GTS) now offer the ability to set the settings for new charts when launched in the platform.
Default Chart Settings allows you to set the default properties for:
Does this apply to my card?
These instructions do not apply to cards beginning in 5295. For all other cards this function must be used to enable web based transactions.
Please follow the instructions below to enable your card to perform web based (online/ecommerce) transactions.
On the login page, enter your Card Number or SAN and Access Code.
DON’T HAVE YOUR ACCESS CODE?
If you don’t know your Access Code, click the “Forgot Access Code?” link below the login button.
Enter your Card Number or SAN and the Email you registered when ordering your card.
You will receive an email with your Access Code.
Return to the login screen and enter your Card Number or SAN and Access Code.
On login, in the middle of the page, you will see an option to enable e-commerce transactions. Check the box and you will be able to complete your transaction within the next 36 hours.
If you are still having difficulty enabling e-commerce transactions after following the instructions above, please contact our Client Services team at +1-888-527-4041, send a message through your online banking account, or email [email protected].
On Wednesday 21 of November 2018 at 08:00 GMT we will be implementing new standard margin rates for FX and CFDs. These margin rates will remain in effect until further notice.
These margin rates will remain in effect until further notice, as we continue to monitor the geopolitical and market situation closely.
What will the margin rates be?
The following tables gives you an overview of the affected instruments on your account.
FX
FX
Current minimum margin
Minimum margin from 21 November
SEK
2.5%
3.0%
RUB
7%
7.5%
CFDs
Index Tracker CFDs
Current minimum margin
Minimum margin from 21 November
EU Stocks 50
3%
4%
Swiss 20
3%
4%
France 40
3%
4%
Netherlands 25
3%
4%
Germany 30
3%
4%
Commodity CFDs
Commodity CFDs CFDs
Current minimum margin
Minimum margin from 21 November
NY Cocoa
5%
8%
Cotton
4%
5%
Soybeans
4%
5%
Silver
8%
5%
Gasoline US
8%
5%
UK Gas Oil
8%
5%
Heating Oil
8%
5%
You can check the upcoming changes to margin rates and collateral requirements for your respective margin profile in the trading platform under ‘Account – Margin and Collateral’.
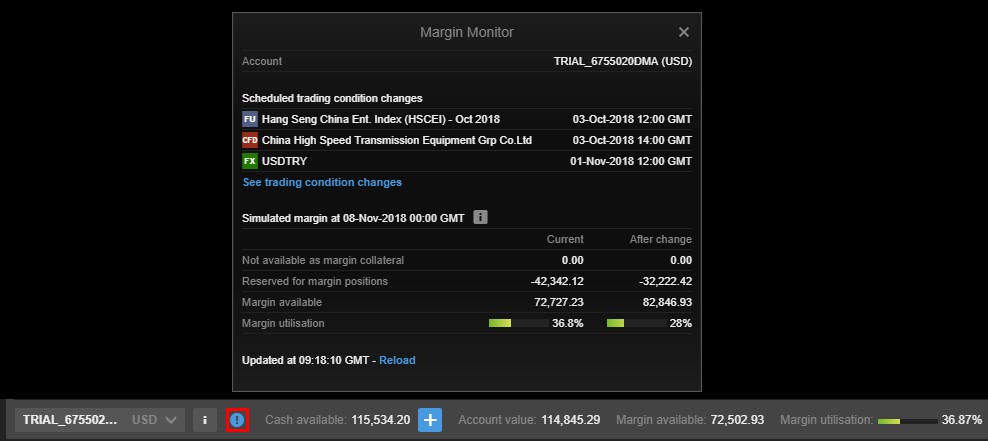
Margin Monitor Feature
Since Monday 22 October, the new ‘Margin Monitor’ feature is be available in GTS Web and GTS Pro, to complement the existing Margin and Collateral changes module. This provides an overview of the positions that are affected by margin changes, and shows the current and the simulated margin after all changes have been applied.
Access to the Margin Monitor
The Margin Monitor will be available through an icon on the Account Toolbar (on the Account Summary in GTS Pro). The Margin Monitor is also available in My Account.
How does this impact your trading?
If you have open positions in any of the affected markets, please ensure that you monitor your positions carefully and maintain sufficient funds in your account to meet the increased margin requirements during this period of turmoil.
We recommend you keep the following in mind, especially when trading during periods of potential market volatility:
Consider placing relevant resting orders in advance. Market liquidity may vary substantially, and trade/quote requests may be unavailable at times as existing resting orders and new market orders are filled as priority
Market orders are not guaranteed to be filled at any specific price – they will be filled “at best” according to available market price when processed
Stop Loss orders are converted to Market orders once triggered, so are not guaranteed to be filled at your stop order level – gaps in available liquidity can result in significant slippage on Stop orders
Using Stop Limit type orders (rather than Stop Market) can be very beneficial as they allow the client to specify the worst acceptable immediate fill rate after triggering, and they will rest in the order book if not able to be filled immediately
Buying options (i.e. puts to protect long positions and calls to protect short positions) could be a hedging vehicle suitable for market uncertainty since they offer protection at the fixed Strike price, rather than Stop orders where fills on gapped prices can occur
More information
If you have any questions, please contact [email protected].
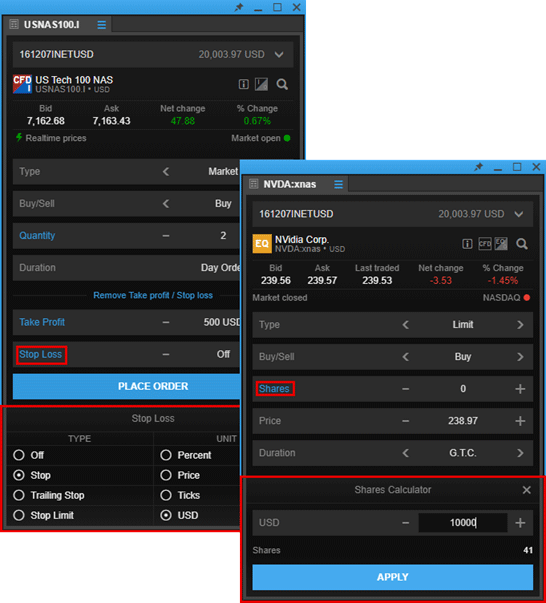
A new trade ticket is now available in GTS Mobile aligning the trade tickets across the web platforms. The new trade ticket offers GTS Mobile users a number of recent enhancements including:
Second currency FX spot trading: clients can set trade amounts in the second currency
Take profit / stop loss in account currency: allows take profit / stop loss orders to be defined as profit or loss amounts in the account currency (in addition to instrument price, distance in % or distance in Ticks / PIPs)
Persistence of input fields: saves input field values for each instrument when a trade or order is placed, persisting them the next time the instrument is selected
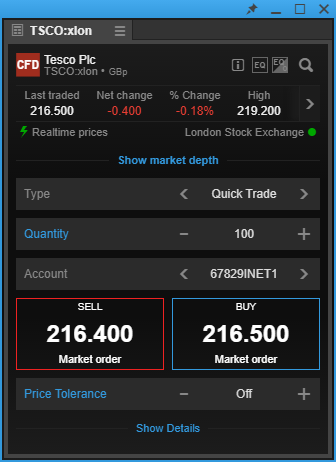
Market depth in Trade Ticket: for clients subscribing to level 2 market data from an exchange, market depth is now also shown in the Trade Ticket for reference
Keyboard support: to efficiently enter trades and orders with basic keyboard support in the Trade Ticket
Share calculator: to select a number of shares (or units of the instrument being traded) from a trade amount in the currency of the selected trading account.
Account selector
For clients that have multiple trading account, the account selector in the Trade Ticket has been moved from the top of the Trade Ticket to be next to the trade buttons.
A new margin monitor is now available through the GTS Web and GTS Pro platforms for monitoring the impact of scheduled coming margin changes on the client’s account.
The margin monitor is available from the account toolbar (account summary in GTS Pro) if margin changes are scheduled which affect the client’s account.
The margin monitor lists any positions affected by margin changes. The margin simulation includes all changes up to the displayed date and time.
In this example, the Amount would normally be placed in EUR but you can now select to place the trade in JPY which will be converted to the EUR amount when you place the trade.
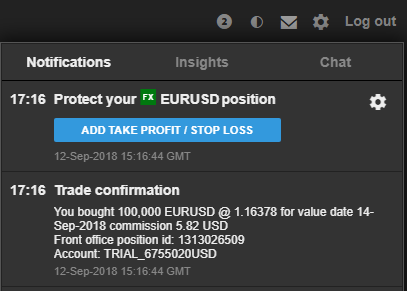
A new feature will soon be available in the GTS Web and GTS Pro platforms which reminds clients to add take profit and stop loss orders after placing a trade.
If no orders already exist for the instrument, a notification is shown after placing a trade with a button which opens the Add Related Orders dialog for the position.
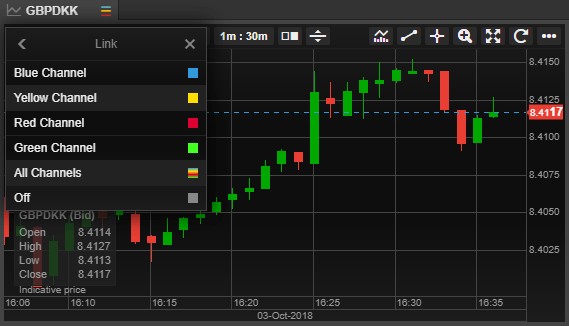
GTS Pro offers linking of modules for quick switching of instruments, for example to an instrument selected in the watchlist, positions list or orders list.
GTS Pro now expand on this functionality to offer multiple channels for more sophisticated platform linking strategies including:
4 different independent channels for linking modules directly together
All Channels to link a module across all the independent channels
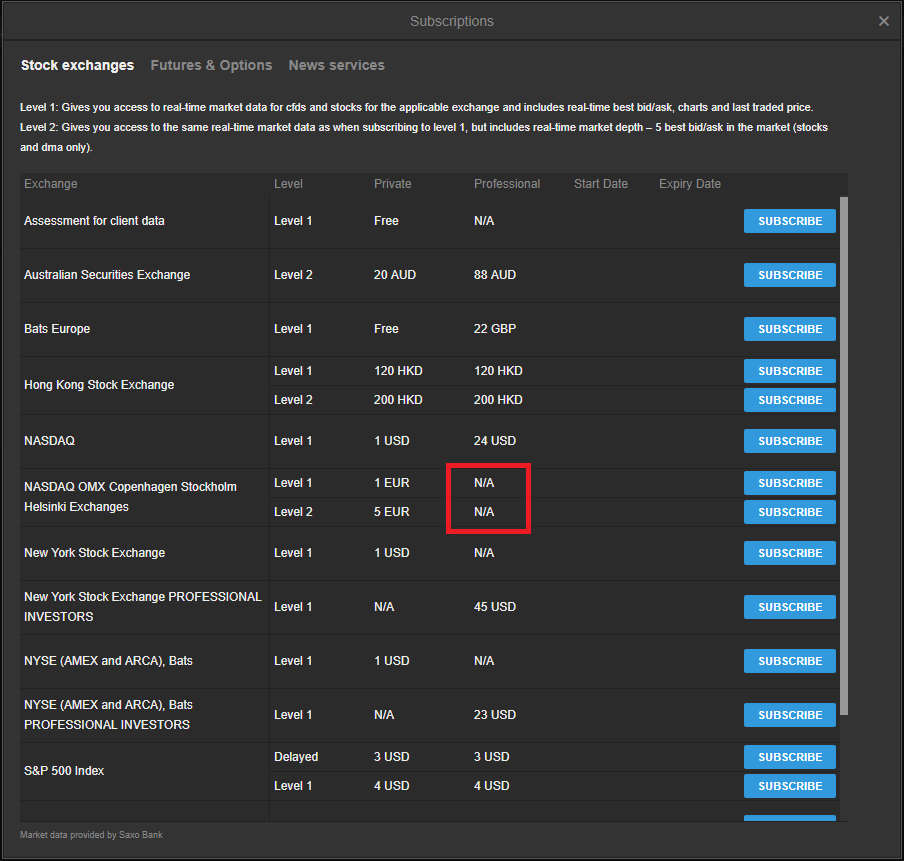
Removal of Non-Professional Subscriptions to Nasdaq OMX Nordic Equities for both live and delayed data
From Jan 01st 2019, xisting subscriptions will be terminated and the ability for clients to subscribe to this exchange as non-professionals will be removed. Professional subscriptions have been removed on Aug 1st 2018 as previously communicated here.
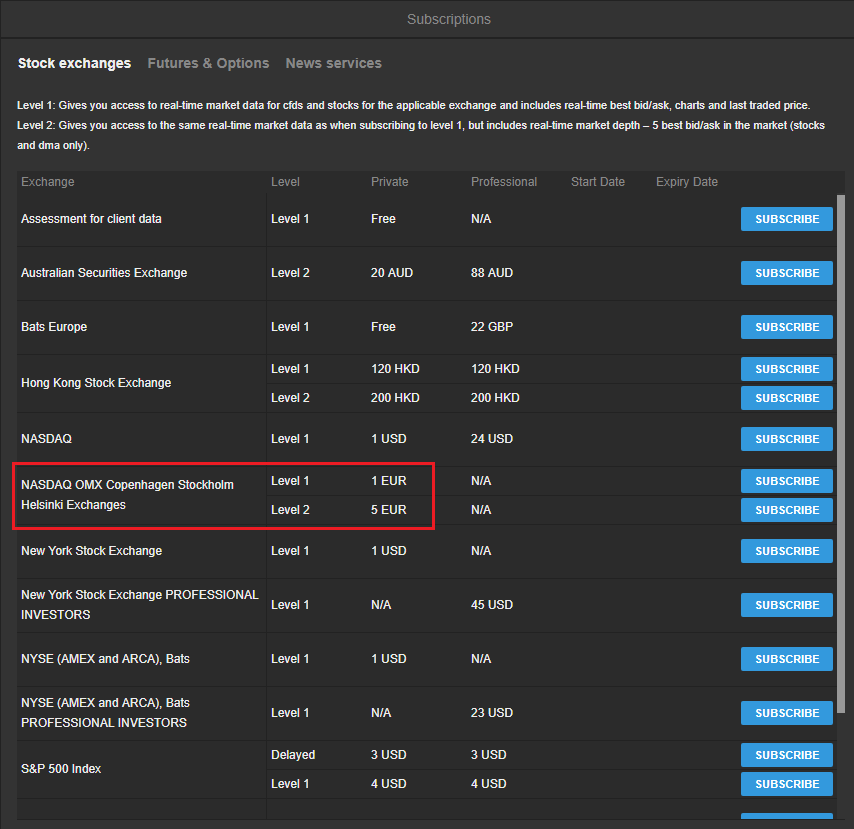
Subscriptions to be removed
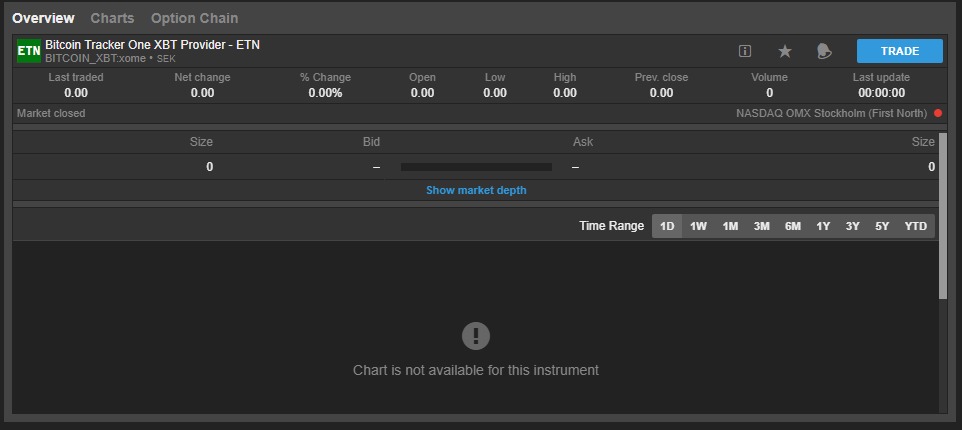
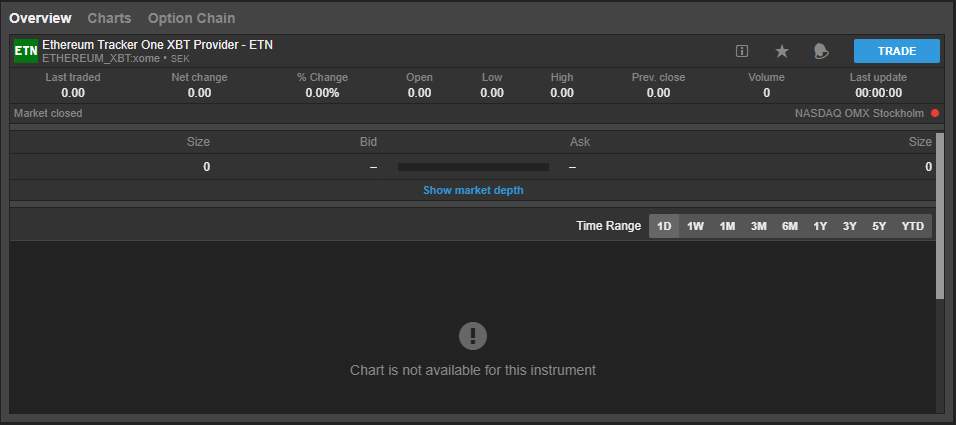
Current view of the instruments
Instruments on OMX that show zero on the price are supposed to be still tradable.
Please contact [email protected] if you have further questions about these changes.
Please be advised that we are no longer going to be supporting Nasdaq OMX Nordic Equities Subscriptions due to changes in the Nasdaq OMX Nordic Equities exchange licensing policies associated with this subscription. Existing subscriptions will be terminated and the ability for clients to subscribe to this exchange as non-professionals will be removed. Professional subscriptions have been removed on Aug 1st 2018 as previously communicated here.
Subscriptions to be removed
Current view of the instruments
Instruments on OMX that show zero on the price are supposed to be still tradable.
Please contact [email protected] if you have further questions about these changes.
Please be advised that we are no longer going to be supporting Nasdaq OMX Nordic Equities Professional Subscriptions due to changes in the Nasdaq OMX Nordic Equities exchange licensing policies associated with this subscription. Existing subscriptions will be terminated and the ability for clients to subscribe to this exchange as professionals will be removed. Private subscribers can still apply for the real-time subscription as usual.
Subscriptions to be removed
Current view of the instruments
Instruments on OMX that show zero on the price are supposed to be still tradable.
Please contact [email protected] if you have further questions about these changes.
On Friday 2 November 2018 at 08:00 GMT we will be implementing new standard margin rates for CFDs, as a result of the continued uncertainty surrounding the Brexit negotiations.
These margin rates will remain in effect until further notice, as we continue to monitor the geopolitical and market situation closely.
What will the margin rates be?
The following table gives you an overview of the affected instruments on your account.
CFDs
CFDs
Minimum margin from 2 November
UK 100
5%
EU Stocks 50
4%
Swiss 20
4%
France 40
4%
Netherlands 25
4%
Germany 30
4%
You can check the upcoming changes to margin rates and collateral requirements for your respective margin profile in the trading platform under ‘Account – Margin and Collateral’ from Friday 19 October 2018 and onwards.
Margin Monitor Feature
From Monday 22 October, a new ‘Margin Monitor’ feature will be available in GTS Web and GTS Pro, to complement the existing Margin and Collateral changes module. This gives you an overview of the positions that are affected by margin changes, and shows the current and simulated margin after all changes have been applied.
Access to the Margin Monitor
The Margin Monitor will be available through an icon on the Account Toolbar (on the Account Summary in GTS Pro). The Margin Monitor is also available in My Account.
How does this impact your trading?
If you have open positions in any of the affected markets, please ensure that you monitor your positions carefully and maintain sufficient funds in your account to meet the increased margin requirements during this period of turmoil.
We recommend you keep the following in mind, especially when trading during periods of potential market volatility:
Consider placing relevant resting orders in advance. Market liquidity may vary substantially, and trade/quote requests may be unavailable at times as existing resting orders and new market orders are filled as priority
Market orders are not guaranteed to be filled at any specific price – they will be filled “at best” according to available market price when processed
Stop Loss orders are converted to Market orders once triggered, so are not guaranteed to be filled at your stop order level – gaps in available liquidity can result in significant slippage on Stop orders
Using Stop Limit type orders (rather than Stop Market) can be very beneficial as they allow the client to specify the worst acceptable immediate fill rate after triggering, and they will rest in the order book if not able to be filled immediately
Buying options (i.e. puts to protect long positions and calls to protect short positions) could be a hedging vehicle suitable for market uncertainty since they offer protection at the fixed Strike price, rather than Stop orders where fills on gapped prices can occur
More information
If you have any questions, please contact [email protected].
During the month of October, we will be updating the trade and order tickets available in GTS for desktop and tablet, aligning the platforms with the current ticket offerings in GTS Mobile and GTS Pro.
Keyboard controls for GTS and GTS Pro
We now have keyboard controls in grids which have been focused on (i.e. active window in GTS Pro or part of the workspace that has been clicked on with the mouse).
Cursor up and down will move up and down items in selected grid
Page up and down will work as expected
Same for HOME and END keys
ENTER will trigger primary action in same manner as mouse double click and launch:
A robust global economy, fuelled by improving US economic data, led developed markets broadly higher during Q2. Dispersion of returns across equity markets increased and there was weakness in emerging markets where growth prospects have been trimmed. European data has also cooled and political risk there has again come to the fore.
United States
Strength in the US dollar continues to be one of the defining features in markets. The US Federal Reserve increased interest rates by 25 basis points for the second time this year and it remains committed to two further hikes within the calendar year. It has resulted in weakness in other currencies, primarily in emerging markets where underperformance has been widespread, partly as a result of reliance on dollar-denominated debt and ensuing pressures on lending activity.
We expect foreign exchange rates to continue to play an important role in markets in the short term and remain positive on the US dollar, largely because of the progressive stance on monetary policy adopted in the US in comparison to other countries. Conditions do not appear ripe for a recession and an imminent equity bear market looks unlikely. The momentum in US assets looks set to continue for now although valuations, particularly in the technology sector, look expensive. Europe and emerging markets are at an earlier stage in the cycle and could outperform if fears regarding global trade wars and political risk in Europe subside.
Europe
Europe committed to ending its Quantitative Easing policy at the end of 2018, although there remains no clear exit for Japan. In the UK, interest rates continue to rise at a glacial pace; with the disappointing economic backdrop setting back the timetable for rate increases.
Equities
The majority of equity markets are still lower in 2018 with the US market a notable exception.
The US produced the best returns in global equity markets and the tech-heavy NASDAQ made a total return of 7.3%. Returns were more modest elsewhere. UK equity returns were augmented by weakness in the pound against the US dollar which has helped exporters. The oil price rallied sharply as the US stepped back from the Iran nuclear deal, meaning that global supply would be lowered as a result of the renewal of sanctions.
Fixed Income
There was little movement in fixed interest markets over the quarter. The sector remains an important source of income and offers diversification.
Gold
The gold price declined by -5.5% as investors moved into riskier investments such as equities. The Absolute Return sector was unchanged and in the current environment it remains difficult for managers within the sector to add value.
Regards,
Euro Pacific Advisors Management Team
Euro Pacific Bank is no longer licensed to do business. As such, we are not accepting new customer accounts.
This website is being maintained by Peter Schiff personally as a memorial to the bank and to update customers on the status of their deposits that have been tied up in receivership since June 30, 2022, and on his personal efforts to recover those customer deposits—including gold and mutual funds—that were transferred to Qenta’s custody and which Qenta is now attempting to keep for itself rather than return to their lawful owners.
The legacy pages and links on this site are preserved solely for historical and educational purposes, to demonstrate how the bank operated while it was in business. They do not represent current offerings.
If you are interested in having an investment account managed by Peter Schiff and his team, please visit http://www.europac.com
If you are interested in buying gold, silver, or other precious metals, please visit http://www.schiffgold.com
If you are interested learning the facts about the J5 conspiracy that resulted in the shutdown of the bank visit http://www.9fraud.com
For official updates and notifications from Euro Pacific Bank’s OCIF-appointed Receiver, who holds exclusive authority to communicate with customers on behalf of the Bank, visit: https://epbprliquidation.com