Euro Pacific Bank

Troubles logging into the GTS Desktop Platform

If you are getting following error message: “… Auto-Detection failed”, please make sure you are connected to the Internet and that your Firewall/Antivirus is not blocking our platform, we strongly recommend you to add the Global TradeStation application to the firewalls allowed programs list.

Otherwise, please try to change connection settings of our Trading platform:

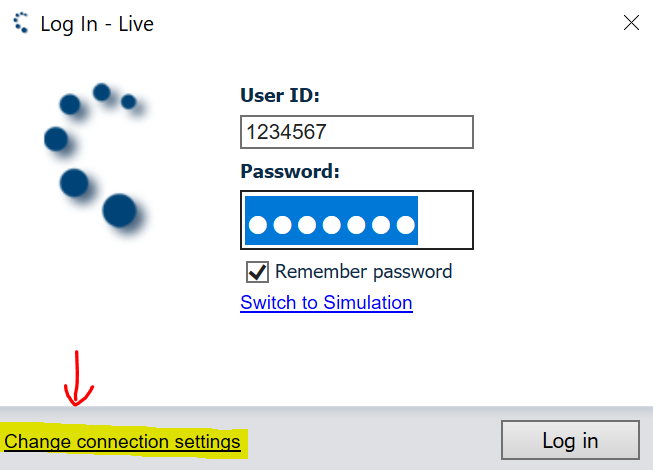
  1. At the login screen of the platform, click on the blue link “Change connection settings”
  2. Under the Protocol option you probably have by default “Auto detect”. Please try following available options: TCP with TLS Security or HTTPS with SSL security and click OK. Now try to login and check if the problem is solved. If not go back to Point 1 and 2 to try the next Protocol option:

If changing the Protocol has not solved the issue, please go through following suggestions:

If the above does not solve your problem, please create a case by sending an email to [email protected] and give exact details of the error seen (including a screenshot if possible).

Easter Trading Hours

Please see below for trading times during the Easter holiday period.

Instrument Thursday, March 29th Good Friday, March 30th Easter Monday, April 2nd Tuesday, April 3rd
FX Normal Hours Normal Hours Normal Hours Normal Hours
FX Metals Normal Hours Closed Normal Hours Normal Hours
Cryptos Normal Hours Normal Hours Normal Hours Normal Hours
AUS200 Normal Hours Closed Closed Normal Hours
GER30 Normal Hours Closed Closed Normal Hours
ES35 Normal Hours Closed Closed Normal Hours
FRA40 Normal Hours Closed Closed Normal Hours
JPN225 Normal Hours Closed Normal Hours Normal Hours
NED25 Normal Hours Closed Closed Normal Hours
EUR50 Normal Hours Closed Closed Normal Hours
SUI20 Normal Hours Closed Closed Normal Hours
GBR100 Closed at 19:00 Closed Normal Hours Normal Hours
NAS100 Normal Hours Closed Normal Hours Normal Hours
SPX500 Normal Hours Closed Normal Hours Normal Hours
US30 Normal Hours Closed Normal Hours Normal Hours
WTIOIL Closed Closed Normal Hours Normal Hours
BRENT Closed Closed Normal Hours Normal Hours

March 2018 New Products & Platform Updates

Market Data Changes from April 1st 2018

GLOBEX (CME, CBOT, COMEX, NYMEX) subscription fee changes for professional clients

GLOBEX (CME, CBOT, COMEX, NYMEX) will be increase fees for market data access for professional clients from 1st of April 2018:

Subscription Level Status Current Price New Price
GLOBEX (CME, CBOT, COMEX, NYMEX) Level 1 Professional 340 USD 420 USD
GLOBEX (CME, CBOT, COMEX, NYMEX) Level 2 Professional 340 USD 420 USD
CME Level 1 Professional 85 USD 105 USD
CME Level 2 Professional 85 USD 105 USD
CBOT Level 1 Professional 85 USD 105 USD
CBOT Level 2 Professional 85 USD 105 USD
COMEX Level 1 Professional 85 USD 105 USD
COMEX Level 2 Professional 85 USD 105 USD
NYMEX Level 1 Professional 85 USD 105 USD
NYMEX Level 2 Professional 85 USD 105 USD

Closed Position Report

The popular Closed Positions report was recently reintroduced in the account section, giving an overview of all positions closed in the period.

The Closed Positions report is a valuable report for accounting and tax purposes, giving access to details of a closed position in both the instrument and account currency.

The Closed Positions report is available under Account > P/L Analysis > Closed Positions in the platforms.

Removal of the Price Feed from Warsaw Exchange after Feb 15th, 2018

EFFECTIVE: Feb 15th 2018

Please be advised that we are no longer going to be supporting Warsaw Exchange price quotes due to substantial increases in pricing associated with offering trading on this exchange.

A. The prices will not be visible

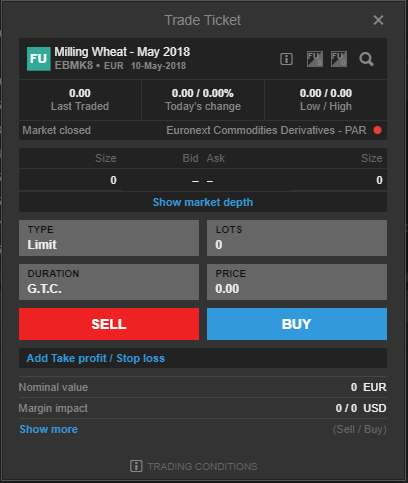
Having the prices removed will mean that none of the Warsaw Exchange traded products will not have a visible price; this applies not only in the trading views but also in the account holding views (See Euronext Exchange example below):

Trading Module:

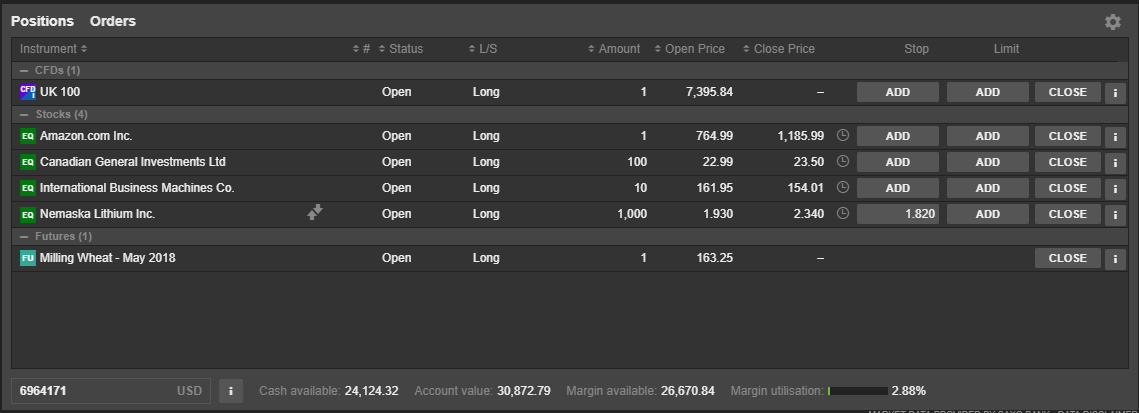
Open positions in Account Summary:

B. The margin calculation will still work

Although the prices are completely gone from the trading platform(s) Global Trading still has the internal use of them for the margin calculation. The upper part of the Account Summary will therefore still show correct unrealized P/L and Margin Utilization, however it will not be possible to match these values with anything in the open positions view:

C. Clients will still be able to close positions

Given that internally we can still see the prices, it is the overall general recommendation that the end clients contact us via the online banking portal or the platform chat tool to close any open positions.

However, technically it is possible for the end-client to close the position on the trading platform(s):

Please contact your private banker if you have any further questions about these changes.

January 2018 New Products & Platform Updates

Time Range Selector

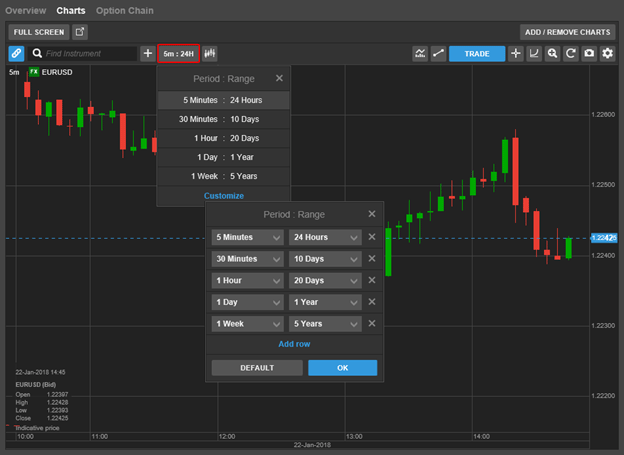
In mid-February 2018 we will be launching a new time range selector for the charts in GTS-Web, allowing you to select a time range as well as a period.

Click on Customise to customise your own period and time ranges – you can have up to 10 default combinations.

Click on Default to reset all combinations to the defaults.

Market Data Changes from March 1st, 2018

Dow Jones and S&P Stock Indices Subscription Fee Change

Dow Jones and S&P Stock Indices will increase their fees for market data access from 1 March 2018:

Service Level Status Current Price New Price
Dow Jones and S&P Stock Indices Delayed Private 2.50 USD 3.50 USD
Dow Jones and S&P Stock Indices Delayed Professional 2.50 USD 4.00 USD
Dow Jones and S&P Stock Indices Level 1 Private 4.00 USD 5.00 USD
Dow Jones and S&P Stock Indices Level 1 Professional 4.00 USD 6.00 USD

SIX Swiss Exchange Subscription Fee Change

SIX Swiss Exchange Level 2 subscriptions will be raised from 56 to 90 CHF for private clients from 1st March, 2018.

CME PRIIPS KIDs (Key Information Documents)

Packaged Retail and Insurance-Based Investment Products (PRIIPs) regulation in the EU, and new rules implemented by CME Group Exchanges, has prompted the provision of Key Information Documents (KIDs) below. In order to continue trading the below specified instruments on the GTS platform, it is of utmost importance for clients to be aware of the inherent risks involved, along with the associated reporting requirements when trading these instruments. Further information and updates may be found at the following links on the CME Group website for PRIIPS Options Products and PRIIPS Futures Products.


PRIIPS Options Product KIDs

Product Type  Transaction Key Information Document Date Costs Updated
English French German Italian Dutch Spanish
Commodities – Cash Settled
Lean Hog Options
Long Call link link   link link   1-Dec-17
Short Call link link   link link   1-Dec-17
Long Put link link   link link   1-Dec-17
Short Put link link   link link   1-Dec-17
Commodities – Physically Delivered
Chicago SRW Wheat Options
Corn Options
Crude Oil Options
Gold Options
Live Cattle Options
Natural Gas Options (American)
Silver Options
Soybean Meal Options
Soybean Options
Long Call link link   link link   1-Dec-17
Short Call link link   link link   1-Dec-17
Long Put link link   link link   1-Dec-17
Short Put link link   link link   1-Dec-17
Equity Indices
E-mini Nasdaq 100 Options
E-mini S&P 500 Options
Long Call link link   link link   1-Dec-17
Short Call link link   link link   1-Dec-17
Long Put link link   link link   1-Dec-17
Short Put link link   link link   1-Dec-17
FX Physically-Delivered
Premium Quoted European Style Options on Australian Dollar/US Dollar Futures
Premium Quoted European Style Options on British Pound/US Dollar Futures
Premium Quoted European Style Options on Canadian Dollar/US Dollar Futures
Premium Quoted European Style Options on Euro/US Dollar Futures
Premium Quoted European Style Options on Japanese Yen/US Dollar Futures
Long Call link link   link link   1-Dec-17
Short Call link link   link link   1-Dec-17
Long Put link link   link link   1-Dec-17
Short Put link link   link link   1-Dec-17
STIRs
Eurodollar Options
Long Call link link   link link   1-Dec-17
Short Call link link   link link   1-Dec-17
Long Put link link   link link   1-Dec-17
Short Put link link   link link   1-Dec-17
Treasury Bonds and Notes
10-Year T-Note Options
U.S. Treasury Bond Options
Long Call link link   link link   1-Dec-17
Short Call link link   link link   1-Dec-17
Long Put link link   link link   1-Dec-17
Short Put link link   link link   1-Dec-17

PRIIPS Futures Product KIDs

Product Type  Key Information Document Product Exchange Commodity Code CME Globex Code Underlying Index Costs Date Costs Updated
Total Costs Reduction in Yield Entry Costs Exit Costs
Agricultural – Cash Settled English
French
German
Italian
Dutch
Lean Hog Futures CME LN HE   $4.06 0.0144% 0.0072% 0.0072% 1-Dec-17
Agricultural – Physically Delivered English
French
German
Italian
Dutch
Chicago SRW Wheat Futures CBOT W ZW   $3.90 0.0178% 0.0089% 0.0089% 1-Dec-17
Corn Futures  CBOT C ZC   $3.90 0.0217% 0.0109% 0.0109% 1-Dec-17
Live Cattle Futures  CME 48 LE   $4.06 0.0083% 0.0042% 0.0042% 1-Dec-17
Soybean Futures CBOT S ZS   $3.90 0.0078% 0.0039% 0.0039% 1-Dec-17
Soybean Oil Futures CBOT 07 ZL   $3.90 0.0193% 0.0096% 0.0096% 1-Dec-17
Soybean Meal Futures CBOT 06 ZM   $3.90 0.0117% 0.0058% 0.0058% 1-Dec-17
Bitcoin  English
French
German
Italian
Dutch
Bitcoin Futures          $10.00 0.0105% 0.0052% 0.0052% 18-Dec-17
Energy – Cash Settled English
French
German
Italian
Dutch
E-Mini Crude Oil Futures NYMEX QM QM   $2.40 0.0082% 0.0041% 0.0041% 1-Dec-17
Energy – Physically Delivered  English
French
German
Italian
Dutch
Crude Oil Futures NYMEX CL CL   $3.00 0.0051% 0.0026% 0.0026% 1-Dec-17
RBOB Gasoline Futures NYMEX RB RB   $3.00 0.0041% 0.0021% 0.0021% 1-Dec-17
Henry Hub Natural Gas Futures NYMEX NG NG   $3.00 0.0098% 0.0049% 0.0049% 1-Dec-17
NY Harbor ULSD Futures NYMEX HO HO   $3.00 0.0037% 0.0018% 0.0018% 1-Dec-17
Equity  English
French
German
Italian
Dutch
E-Mini Dow ($5) Futures CBOT YM YM link $2.32 0.0019% 0.0010% 0.0010% 1-Dec-17
E-Mini Nasdaq 100 Futures CME NQ NQ link $2.36 0.0019% 0.0009% 0.0009% 1-Dec-17
E-Mini S&P 500 Futures CME ES ES link $2.36 0.0018% 0.0009% 0.0009% 1-Dec-17
Nikkei/Yen Futures CME N1 NIY link $4.30 0.0042% 0.0021% 0.0021% 1-Dec-17
FX – Physically Delivered  English
French
German
Italian
Dutch
Australian Dollar Futures CME AD 6A   $3.20 0.0042% 0.0021% 0.0021% 1-Dec-17
British Pound Futures CME BP 6B   $3.20 0.0038% 0.0019% 0.0019% 1-Dec-17
Canadian Dollar Futures CME C1 6C   $3.20 0.0041% 0.0020% 0.0020% 1-Dec-17
Euro FX Futures CME EC 6E   $3.20 0.0022% 0.0011% 0.0011% 1-Dec-17
Japanese Yen Futures CME J1 6J   $3.20 0.0029% 0.0014% 0.0014% 1-Dec-17
Metals – Cash Settled prodcuts  English
French
German
Italian
Dutch
Iron Ore 62% Fe, CFR China (TSI) Futures NYMEX TIO TIO           1-Dec-17
Metals – Physically-Delivered products  English
French
German
Italian
Dutch
Gold Futures COMEX GC GC   $3.00 0.0023% 0.0012% 0.0012% 1-Dec-17
Copper Futures COMEX HG HG   $3.00 0.0039% 0.0019% 0.0019% 1-Dec-17
Platinum Futures NYMEX PL PL   $3.00 0.0064% 0.0032% 0.0032% 1-Dec-17
Silver Futures COMEX SI SI   $3.00 0.0037% 0.0018% 0.0018% 1-Dec-17
STIRs English
French
German
Italian
Dutch
Eurodollar Futures  CME ED GE   $2.50 0.0010% 0.0005% 0.0005% 1-Dec-17
Treasury Bonds and Notes  English
French
German
Italian
Dutch
10-Year T-Note Futures CBOT 21 ZN   $1.50 0.0012% 0.0006% 0.0006% 1-Dec-17
U.S. Treasury Bond Futures CBOT 17 ZB   $1.60 0.0010% 0.0005% 0.0005% 1-Dec-17


Removal of the Price Feed from Euronext Exchange after December 31st, 2017

EFFECTIVE: Jan 2nd 2018

Please be advised that we are no longer going to be supporting Euronext Exchange price quotes for derivatives (CFDs, Options and Futures) and some Equities (Stocks and ETFs, except the ones traded on the BATS Exchange) due to substantial increases in pricing associated with offering trading on this exchange.

A. The prices will not be visible

Having the prices removed will mean that none of the Euronext Exchange traded products will not have a visible price; this applies not only in the trading views but also in the account holding views:

Trading Module:

Open positions in Account Summary:

B. The margin calculation will still work

Although the prices are completely gone from the trading platform(s) Global Trading still has the internal use of them for the margin calculation. The upper part of the Account Summary will therefore still show correct unrealized P/L and Margin Utilization, however it will not be possible to match these values with anything in the open positions view:

C. Clients will still be able to close positions

Given that internally we can still see the prices, it is the overall general recommendation that the end clients contact us via the online banking portal or the platform chat tool to close any open positions.

However, technically it is possible for the end-client to close the position on the trading platform(s):

Please contact your private banker if you have any further questions about these changes.

December 2017 New Products & Platform Updates

GTS MobileTrader Enhancements

Over the coming months, improvements in design and functionlity will be coming to the mobile platform.

Navigation Improvements

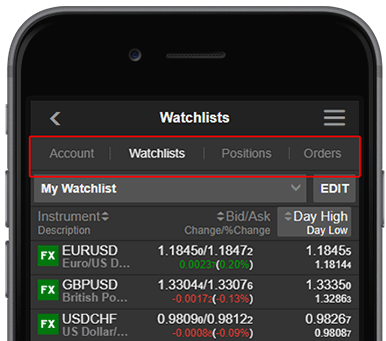
Improvements to the navigation offering quick navigation between the most used sections of the platform:

  • Watchlist
  • Positions
  • Order
  • Account

Search Enhancements

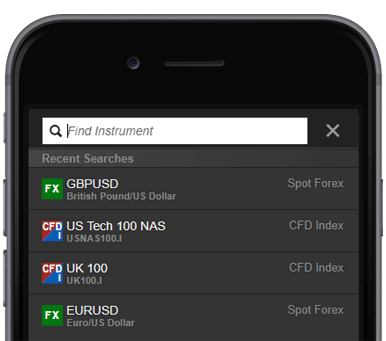
Search will deliver recently viewed instruments alongside a search input field for quick and easy access.

Market Data Changes (Reminder)

A number of exchanges will increase real-time data fees from 1 January, 2018.

Stock Exchanges: Private Professional
  Level Currency Current Price New Price Current Price New Price
Euronext Stock Exchange Level 1 EUR 1.00 1.25 63.00 68.00
Level 2 EUR 1.00 1.50 91.00 95.00
Euronext Stock Indices Level 1 EUR 1.00 1.25    
Futures Exchanges: Private Professional
Euronext Commodities Derivatives Level 2 EUR 12.00 15.00 12.00 15.00
Euronext Equity & Index Derivatives Level 1 EUR 1.00 1.25    
Level 2 EUR 32.00 34.00 32.00 34.00
OPRA Data Level 1 USD     30.50 31.50

New Account Section Coming to GTS

The New Account Section recently introduced in the GTS-web platform will also be enabled in the desktop application. For more details, see here.

November 2017 New Products & Platform Updates

Product Updates

New Ethereum tracker ETN now available

After getting exposure to Bitcoin, clients can now also get access to trade the Ethereum ETNs listed on Nasdaq OMX Stock Exchange. As previously announced, two Bitcoin Tracker ETNs listed on the same exchange are also offered.

Please note, a subscrition to the Nasdaq OMX Stock Exchange to acqire access to the ETNs.

Please note there is inherent risk involved in trading ETNs, including credit, liquidity, and market risks involved in trading these products.

Product Enhancements

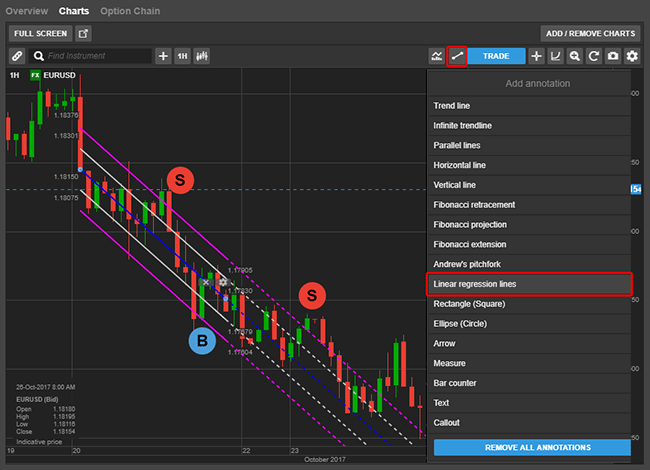
New Chart Annotation Tool – Linear Regression Lines

Linear Regression Lines is a new statistical chart annotation tool which tries to predict future values from past values and is a straight line that best fits the prices between a starting price point and an ending price point.

A “best fit” means that a line is constructed where there is the least amount of space between the price points and the actual Linear Regression Line.

Traders use the Linear Regression Lines to try to determine a trend direction regarded as the fair value. If the price for an instrument is below a Linear Regression Line for some time, it could be an indication of a trend change and this could be considered a buy signal. Similarly, if the price is above the Linear Regression Line it could be considered a sell signal.

It can be difficult to identify how far below or above the line a price should move from the Linear Regression Line before it is a good buy or sell signal. For more objective indicators, extra lines can be added parallel to the Linear Regression Channel – we have added extra lines by default at ±1 and ±2 Standard Deviations. You can remove these outer lines in the configuration settings for the annotation.

The following EURUSD chart shows a Linear Regression Channel with the lines extended (shown as dashed lines).

We have indicated a few areas on the chart where it might be a good signal to buy or sell i.e. when the price crosses the outer 2 Standard Deviations line from the Linear Regression.

In the configuration settings for each Linear Regression Line you can delete or add lines, extend them as well as the usual configuration such as colors, line type and calculation details.

Improved user experience to remove all annotations and studies on an instrument

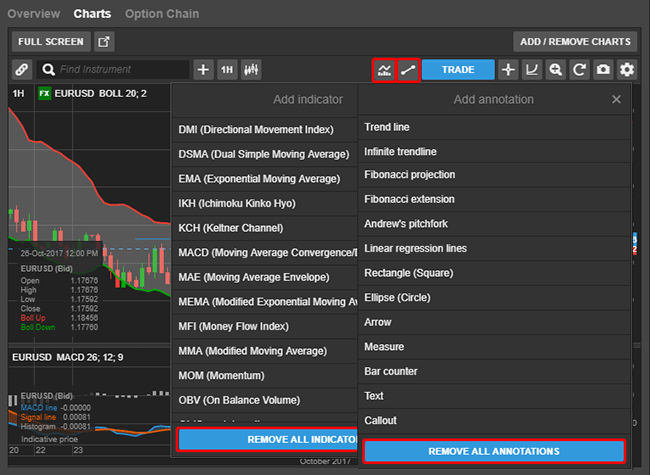
Existing annotations and studies on an instrument can now be removed all at once, making it easier for traders to start a new analysis on the same instrument.

A new Remove all Indicators button will be available from 4 November 2017 in the Indicator drop down menu which will remove all annotations and studies on the current instrument.

Similarly, a Remove all studies is available in the Studies menu to remove all studies on the instrument (both overlay and sub-panels studies are removed).

Upgrade to GTS Pro mandatory from 1 December 2017 – Reminder

The recent upgrade to GTS Pro becomes mandatory from 1 December 2017. Because the upgrade cannot be installed on Windows XP and Windows Vista, it will no longer be possible to use the platform on these operating systems by 1 December.

Operational Changes

Market Data Changes

General market data subscription fees changes as of 1 January 2018

The following exchanges and data providers will change their subscription fees for market data access from 1 January 2018.

Stock Exchanges: Private Professional
  Level Currency Current Price New Price Current Price New Price
Euronext Stock Exchange Level 1 EUR 1.00 1.25 63.00 68.00
Level 2 EUR 1.00 1.50 91.00 95.00
Euronext Stock Indices Level 1 EUR 1.00 1.25    
Futures Exchanges: Private Professional
Euronext Commodities Derivatives Level 2 EUR 12.00 15.00 12.00 15.00
Euronext Equity & Index Derivatives Level 1 EUR 1.00 1.25    
Level 2 EUR 32.00 34.00 32.00 34.00
OPRA Data Level 1 USD     30.50 31.50

New Account Section Coming to GTS

Table of Contents

Portfolio Overview

P/L and Cash Movements Tools

New Portfolio Overview

New Navigation

Historic Reports

Deposit and Transfer

Other Account Functions


Portfolio Overview

The new Performance Overview offers a dashboard showing your Account Performance, percentage returns and changes in cash value of the account (or all accounts) for the selected period

Account Summary

The Account Summary includes the:

  • Account Value at the start and end of the selected period and the Change in Account Value
  • P/L related to trading activities (trade P/L, costs, financing, corporate actions etc.)
  • Non-trading related bookings such as cash and security Transferred (interest, exchange subscriptions, exchange rate movements, etc.)

Account Value chart

The development of your account value over the selected period including cash and security transfers and everything booked on the account.

Instrument P/L

The Instrument P/L tab gives access to P/L breakdown for the selected account(s) and period.

P/L figures In the Instrument P/L section include:

  • Realized gains and losses (positions closed in the period) 

  • Unrealized gains and losses (positions still open at the end of the period

  • All trading costs associated with a position such as holding costs, financing charges, rollovers, corporate actions, coupons, etc.

P/L Bar Chart

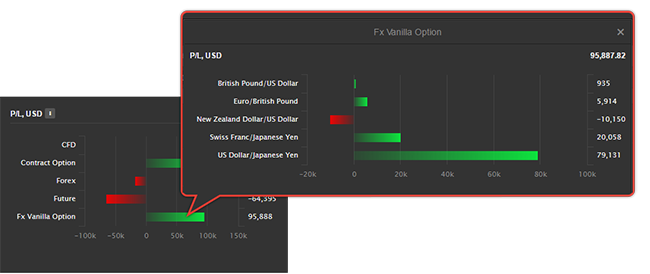
The P/L bar chart shows the net P/Ls for each product traded in the period.

Click on a bar to show the P/L breakdown for individual instruments traded in the period.
Top 3 Gainers and Losers

Top 3 Gainers and Losers show the 3 instruments with the greatest gain and loss in the selected period.

Cumulative P/L chart

The Cumulative P/L chart shows the development of the P/L on the account(s).

Monthly Return table

The monthly returns table shows the P/L by month since the account was opened.

Returns

Returns gives access to % returns for the selected account(s) and period:

%Return Chart

The % Return chart shows the development as the time-weighted percentage performance over the period excluding cash and security transfers.

Winning % Indicators

  • The percentage of days in the period where your account had a profit/loss.
  • The percentage of closed trades in the period with a profit/loss.

Statistics

Account statistics for the selected period.

Monthly % returns table

The monthly returns table shows the % returns by month since the account was opened.

Cash

The cash panel shows the development of the cash balance for the selected account(s) and period.

Cash Balance Chart

The % Return chart shows the development in the end-of-day cash balance over the period including cash and security transfers.

Cash Balance Summary

The Cash Balance Summary includes the:

  • Cash Balance at the start and end of the selected period and the Total Cash Movements in the period
  • Realized P/L from positions closed in the period (trade P/L, costs, financing, corporate actions etc.)
  • Cash Transfers and Other bookings from non-trading related bookings such as cash and security Transferred (interest, exchange subscriptions, exchange rate movements, etc.)

Cash Movements Bar Chart

The Cash Movements bar chart shows the net cash movement for each product traded, cash transfers and other booking types in the period.


P/L and Cash Movements Tools

P/L Analysis tools allows you to analyze P/L, associated costs and bookings down to the instrument level in detail. Analyze P/L by trading product, specific instruments or sectors, charting the cumulative P/L graphically or itemizing all transactions associated with product or instrument.

Profit/Loss

Profit/Loss allows you to analyze and show the cumulative Profit and Loss through trading an instrument, product or sector in a selected period.

For a selected period and account (or all accounts) you can analyze P/L by:

  • Asset Type to analyze P/L by product (FX, CFD, Stocks, Futures etc.) and drill down to the instruments traded within a product
  • Instrument to see the cumulative P/L development from trading a specific instrument
  • Sector (where sector information is available) showing P/L by instruments traded within each sector
  • Custom grouping P/L by any combination of Asset Type (product), month, year, sector, and instrument), for example, to show P/L by instrument, grouped by month traded (closed)

Cash Movements

Cash Movements allows you to analyze all bookings on your account (cash movements) associated with trading in a product or a particular instrument.

For a selected period and account (or all accounts) you can analyze bookings by:

  • Asset Type to analyze bookings by product (FX, CFD, Stocks, Futures etc.) to drill-down to bookings for each the instruments traded within a product
  • Instrument to see bookings for a trades in a specific instrument
  • Sector (where sector information is available), showing bookings by industry. This also allow you to drill-down to the instruments traded within each sector
  • Custom groupings showing bookings by any combination of Asset Type (product), month, year, sector, and instrument to show for example, bookings grouped by month traded (closed) for example

Closed Positions

For a selected period, Closed Positions shows positions that have been closed and booked on your account (or all accounts).

You can filter the Closed Positions by asset type (product) to limit the results shown.


New Portfolio Overview

The Portfolio Overview gives an overview of current net holdings on an account(s) and gives access to a historic view of the portfolio.

Allocation

The Portfolio Overview shows the following:

  • exposure to each instrument and product (in the currency of the instrument)
  • % allocation of the instrument of the holdings in that asset class (product)
  • % allocation of the instrument of the total portfolio

Current Account Values

The Portfolio Overview also gives shows the current cash available, value of positions and account value, and shows the % days change on the account.

Historic View

You can see how your portfolio looked historically at the end of any day using the date selector showing the account values, holdings and allocations at the end of selected.


New Navigation

The new Account Section introduces horizontal navigation aligned with the rest of the GTS platform. The simplified navigation reduces the number of Account Sections and maximizes the available space for reports.


Historic Reports

Historic Reports have been reorganized into tiles giving a better overview and description of the report.


Deposit and Transfer

Transferring funds and withdrawing funds to and from your account, security transfers have also been organized into convenient tiles in the Deposit and Transfers section of the Account Section.


Other Account Functions

Trading Conditions, Subscriptions, Activity log, Contact Support Upcoming Margin and Collateral Changes, Mifid Status, Corporate action events have been moved under the Other menu and re-organized as tiles with a description of the service.
LAST UPDATED: OCTOBER 31, 2024

October 31, 2024: Receiver's Report.

October 16, 2024: Receiver's Notice.

October 04, 2024: Migration Update.

April 16, 2024: Receiver's Reports.

April 13, 2024: Migration & Liquidation update.

March 11, 2024: Receiver's Reports.

March 03, 2024: Migration & Liquidation update.

February 19, 2024: Migration & Liquidation update.

February 02, 2024: Migration & Liquidation update.

November 21, 2023: Migration Update (Opt-in Only).

November 20, 2023: Progress Report (Opt-out Only).

September 22, 2023: Report & Communication Portal.

September 01, 2023: Migration & Liquidation update.

July 20, 2023: Migration & Liquidation update.

June 23, 2023: Migration & Liquidation update.

June 17, 2023: Receiver's report.

May 31, 2023: Migration & Liquidation update.

May 05, 2023: Migration & Liquidation update.

April 20, 2023: Liquidation update- Action required.

March 31, 2023: Migration & Liquidation update.

March 8, 2023: Migration & Liquidation update.

January 27, 2023: Correspondent bank update.

December 16, 2022: Comprehensive FAQ is published.

December 05, 2022: Migration & liquidation update.

November 01, 2022: Mutual funds & outgoing wire requests update.

October 21, 2022: Update on Opt-out deadline - Extended.

October 14, 2022: Customer Update & Townhall.

October 8, 2022: Update on opt-out deadline for EPB clients who do not wish to migrate their account to Qenta Inc.

September 30, 2022: Update on bank liquidation, pending transactions, and migration of assets to Qenta Inc.

September 28, 2022: Update on pending transactions for clients opting out of Qenta Inc. migration.

September 16, 2022: Update on pending transactions for clients opting out of Qenta Inc. migration.

September 8, 2022: Qenta has emailed a welcome letter to all EPB clients. You can read a copy of it here.

September 2, 2022: Update on pending transactions, brokerage, and account migration.

August 29, 2022: Euro Pacific Bank liquidation has commenced. Please read our formal instructions here as it is time-sensitive.