From 19 December 2018 we have implemented a small but significant change to the way that we handle FX trailing stop orders.
-Trailing stop if offered orders to sell will now follow the bid price (previously they followed the offer). They will continue to be triggered on the offer price.
-Trailing stop if bid orders to buy, will now follow the offer price (previously they followed the bid). They will continue to be triggered on the bid price.
Previously, where a trailing stop if offered order to sell followed the offer price, spread widening would result in the stop order being dragged higher by a temporary spike. When the spread returned to normal levels, the stop order would then be triggered resulting in unexpected trailing stop behaviour.
We have therefore made this small change to protect clients from unexpected order fills as result of spread widening around market volatility or market opening e.g. Sunday open.
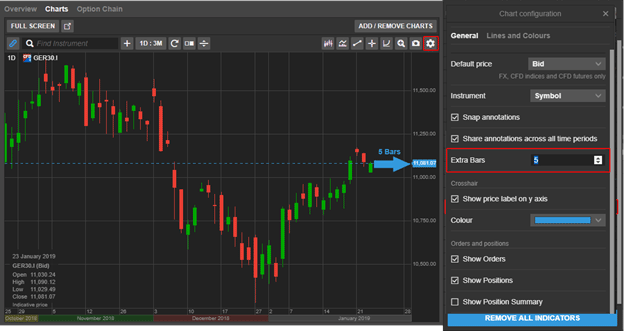
Extra Bars is a useful new feature that allows you to create space between last updated bar or candle and the y-axis, adding space for projecting annotations into the future.
You can add space from chart configuration menu available from the right-click menu (desktop) or the chat settings icon.
Annotation persistence across chart windows
Chart annotations are now remembered for each instrument and will be available whenever you open a new chart for the instrument.
If you have several instances of a chart open for the same instrument, the most recent changes to the chart annotations will be used.
Time range persistence when zooming
If you zoom or pan in the chart, the chart now persists the time range if you close and reopen the platform, detach the chart or select another instrument. If I pan the chart to show a time range of 2016 – 2017 for example, opening a new instrument in the chart will show the time range 2016 – 2017.
Click on the Reset icon to quickly reset to the time range selected.
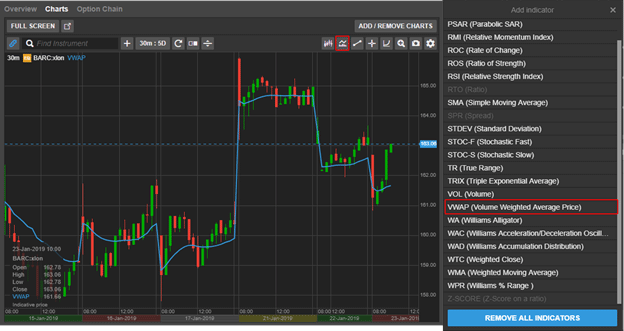
Improved Volume Weighted Average Price (VWAP) indicator (9th February)
The calculation behind the Volume Weighted Average Price (VWAP) indicator will be improved to more accurately display the average weighted price by volume – the value of all trades in a trading session divided by trading volume.
VWAP is similar to a moving average with a lagging indicator used on intraday time periods only. Contrary to the moving average, VWAP accumulates volume throughout the trading session.
VWAP can be used to compare the current price to the VWAP value to determine the general direction for the instrument – if current price is below the VWAP line prices are falling, if above prices are rising.
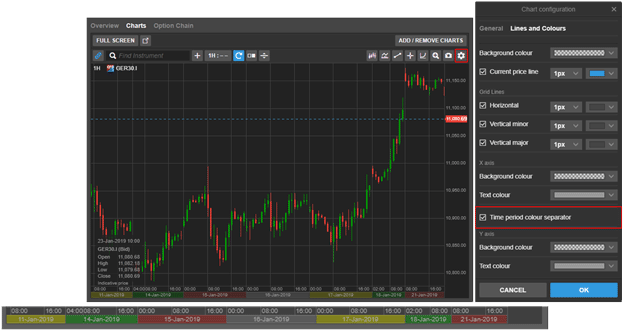
X-axis time period colour separator (9th February)
To improve the readability you will be able to add colours to the x-axis to make it easier to quickly identify different trading periods.
Go add colours to the time period under Chart Configuration > Lines and Colours the check the Time period colour separator checkbox
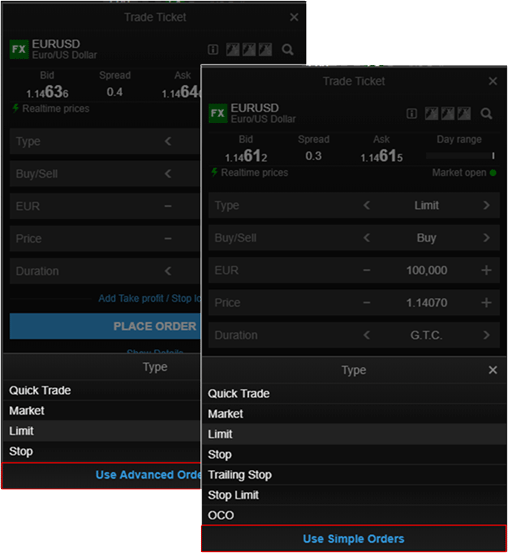
From February, an option will be available in the Trade Ticket when placing orders, allowing you to simplify the order types, hiding complex order types and limiting the list to Market, Limit and Stop orders used by most clients.
A number of design updates to GTS Mobile will be released in the coming months. In close contact with clients, we have been making a number of usability improvements to the mobile trader. Most notably we will increase the font sizes and certain navigation buttons and icons to improve legibility and navigation.
Font sizes will also be increased on GTS Mobile on the desktop.
A number of enhancements will soon be released in the GTS Pro platform allowing traders to more efficiently navigate the platform using the keyboard.
From February 2019, FX stop orders will be simplified where Stop if Bid and Stop if Offered will be labelled Stop orders throughout the platform in trade confirmations and order and position lists. Similarly, Trailing stop if Bid and Trailing Stop if Offered orders will be labelled Trailing Stop orders.
These orders will continue to be placed and triggered in the same way.
To provide better service clients, we are happy to announce that from 4th February 2019:
Notifications on mandatory corporate events
Corporate Action Notifications will be provided on mandatory events for Stocks, Bonds and Mutual Funds.
Clients can access this information under Account > Other > Corporate Action Mandatory Events. Events will be shown until their Ex date/effective date + 30 days.
Due to a deterioration in the underlying liquidity available in XPDUSD, we are no longer able to support trading in Palladium/USD.
From Monday 21 January 2019 clients are no longer be able to open new positions in XPDUSD and by Friday 15 February 2019 all existing positions must be closed. After this date, we will close all open positions and cancel any open orders on your behalf.
Please note that should you wish to gain exposure to Palladium, we continue to offer trading of Palladium CFDs and Palladium (PA) Futures.
Please contact [email protected] if you have further questions about these changes.
On Wednesday 21 of November 2018 at 08:00 GMT we will be implementing new standard margin rates for FX and CFDs. These margin rates will remain in effect until further notice.
These margin rates will remain in effect until further notice, as we continue to monitor the geopolitical and market situation closely.
What will the margin rates be?
The following tables gives you an overview of the affected instruments on your account.
FX
FX
Current minimum margin
Minimum margin from 21 November
SEK
2.5%
3.0%
RUB
7%
7.5%
CFDs
Index Tracker CFDs
Current minimum margin
Minimum margin from 21 November
EU Stocks 50
3%
4%
Swiss 20
3%
4%
France 40
3%
4%
Netherlands 25
3%
4%
Germany 30
3%
4%
Commodity CFDs
Commodity CFDs CFDs
Current minimum margin
Minimum margin from 21 November
NY Cocoa
5%
8%
Cotton
4%
5%
Soybeans
4%
5%
Silver
8%
5%
Gasoline US
8%
5%
UK Gas Oil
8%
5%
Heating Oil
8%
5%
You can check the upcoming changes to margin rates and collateral requirements for your respective margin profile in the trading platform under ‘Account – Margin and Collateral’.
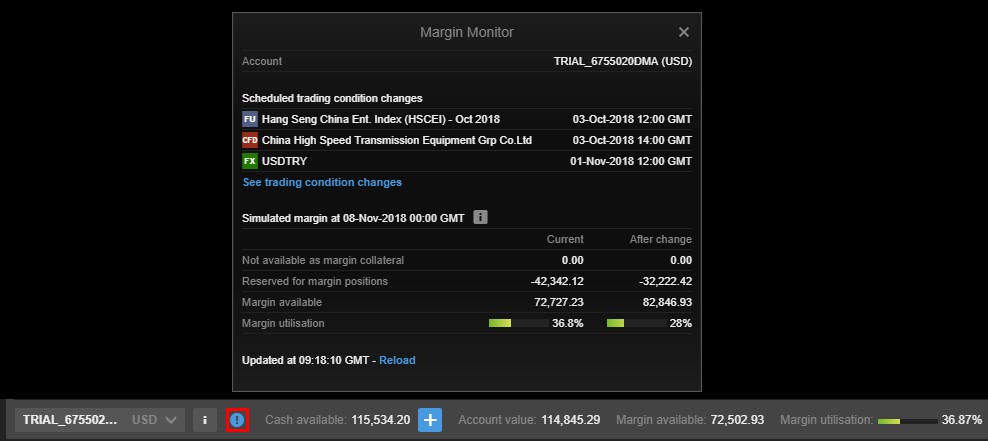
Margin Monitor Feature
Since Monday 22 October, the new ‘Margin Monitor’ feature is be available in GTS Web and GTS Pro, to complement the existing Margin and Collateral changes module. This provides an overview of the positions that are affected by margin changes, and shows the current and the simulated margin after all changes have been applied.
Access to the Margin Monitor
The Margin Monitor will be available through an icon on the Account Toolbar (on the Account Summary in GTS Pro). The Margin Monitor is also available in My Account.
How does this impact your trading?
If you have open positions in any of the affected markets, please ensure that you monitor your positions carefully and maintain sufficient funds in your account to meet the increased margin requirements during this period of turmoil.
We recommend you keep the following in mind, especially when trading during periods of potential market volatility:
Consider placing relevant resting orders in advance. Market liquidity may vary substantially, and trade/quote requests may be unavailable at times as existing resting orders and new market orders are filled as priority
Market orders are not guaranteed to be filled at any specific price – they will be filled “at best” according to available market price when processed
Stop Loss orders are converted to Market orders once triggered, so are not guaranteed to be filled at your stop order level – gaps in available liquidity can result in significant slippage on Stop orders
Using Stop Limit type orders (rather than Stop Market) can be very beneficial as they allow the client to specify the worst acceptable immediate fill rate after triggering, and they will rest in the order book if not able to be filled immediately
Buying options (i.e. puts to protect long positions and calls to protect short positions) could be a hedging vehicle suitable for market uncertainty since they offer protection at the fixed Strike price, rather than Stop orders where fills on gapped prices can occur
More information
If you have any questions, please contact [email protected].
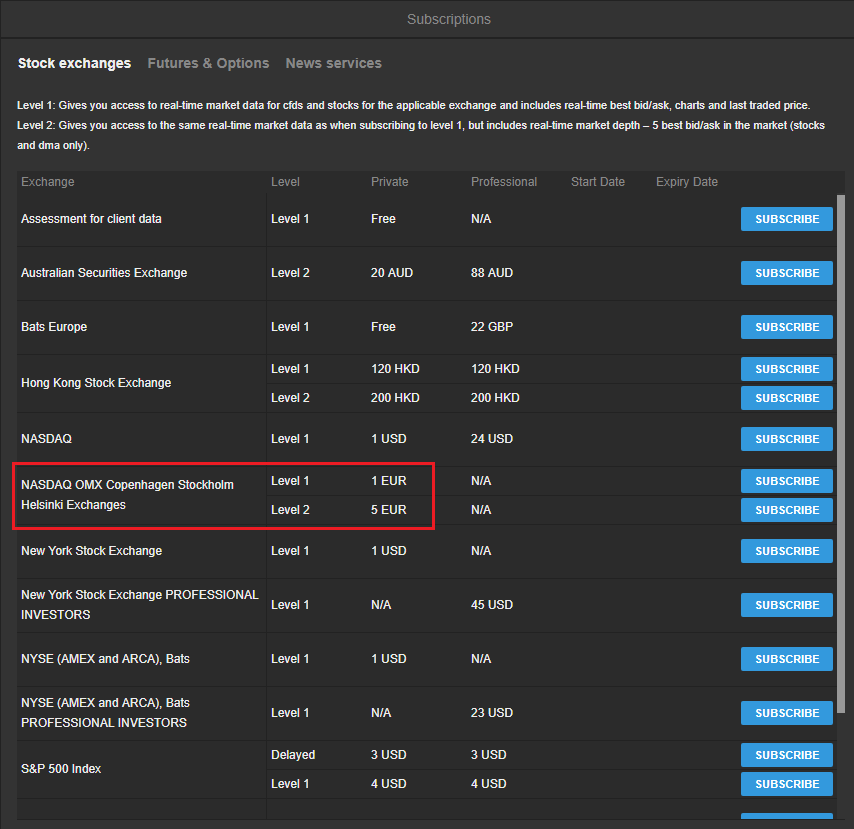
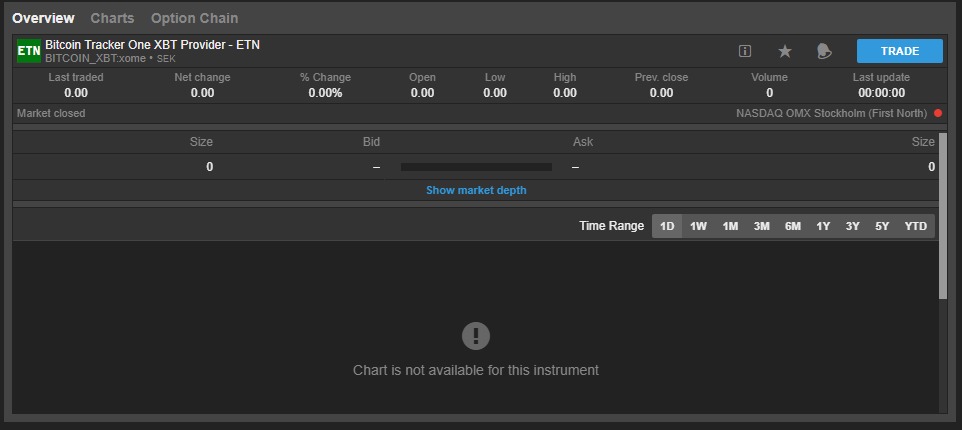
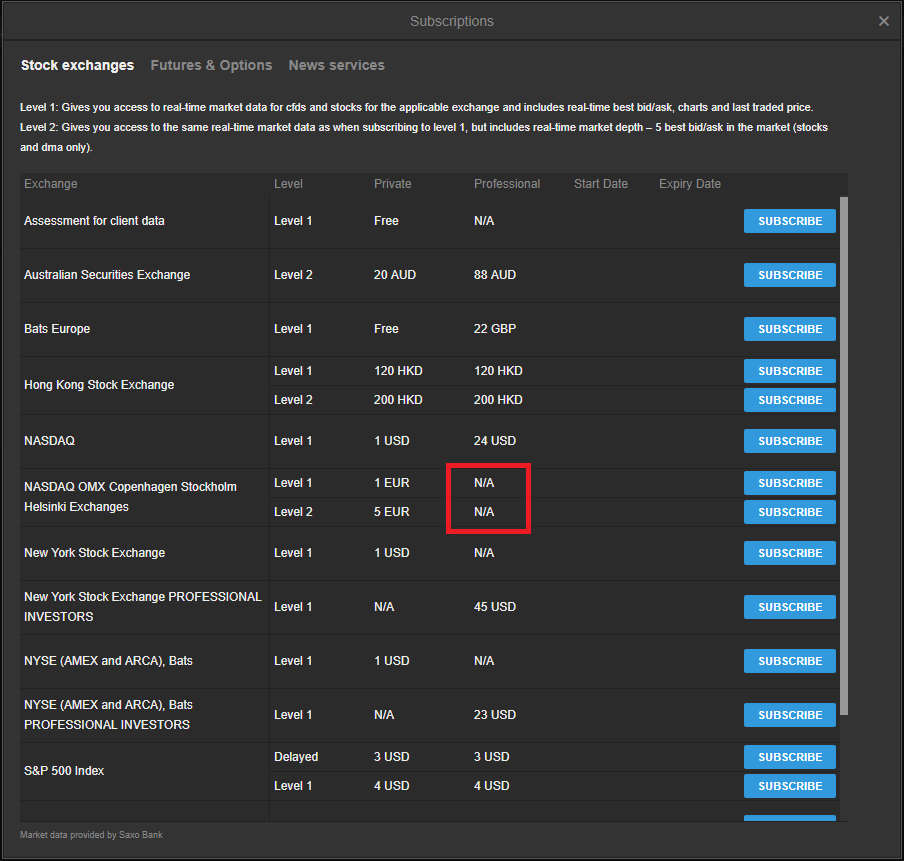
Please be advised that we are no longer going to be supporting Nasdaq OMX Nordic Equities Subscriptions due to changes in the Nasdaq OMX Nordic Equities exchange licensing policies associated with this subscription. Existing subscriptions will be terminated and the ability for clients to subscribe to this exchange as non-professionals will be removed. Professional subscriptions have been removed on Aug 1st 2018 as previously communicated here.
Subscriptions to be removed
Current view of the instruments
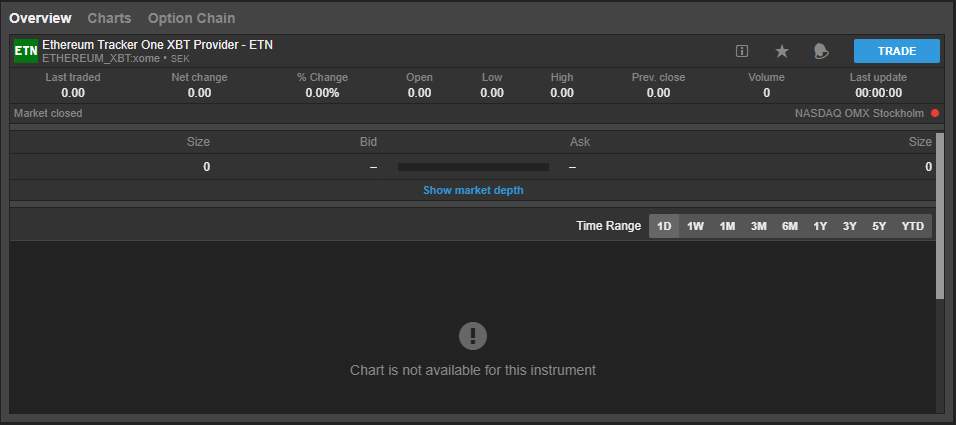
Instruments on OMX that show zero on the price are supposed to be still tradable.
Please contact [email protected] if you have further questions about these changes.
Please be advised that we are no longer going to be supporting Nasdaq OMX Nordic Equities Professional Subscriptions due to changes in the Nasdaq OMX Nordic Equities exchange licensing policies associated with this subscription. Existing subscriptions will be terminated and the ability for clients to subscribe to this exchange as professionals will be removed. Private subscribers can still apply for the real-time subscription as usual.
Subscriptions to be removed
Current view of the instruments
Instruments on OMX that show zero on the price are supposed to be still tradable.
Please contact [email protected] if you have further questions about these changes.
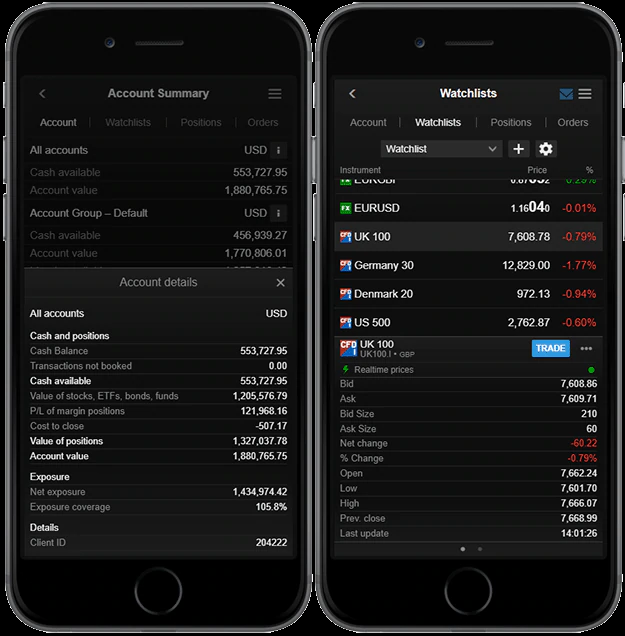
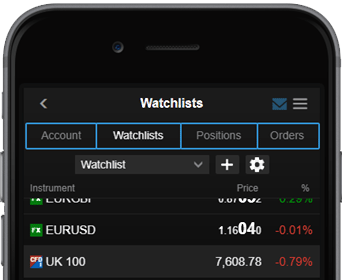
The new navigation makes it fast and easy to access the main components: Account Summary Watchlists, Positions and Orders in a single tap.
Other functions are accessed through the menu icon.
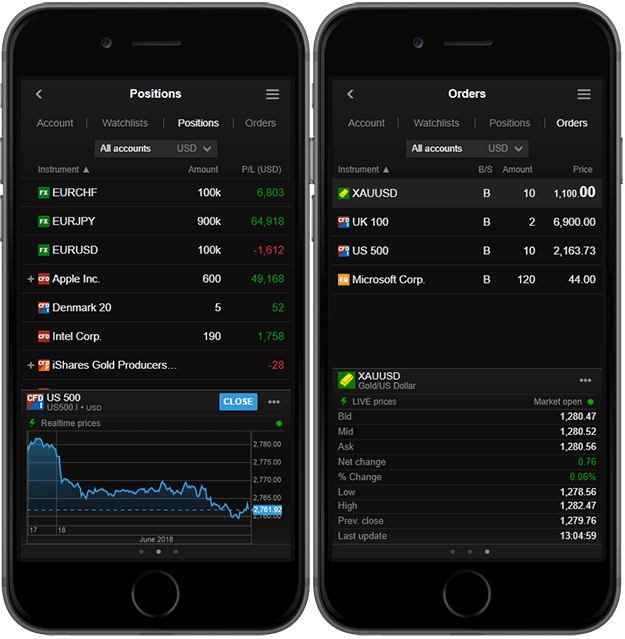
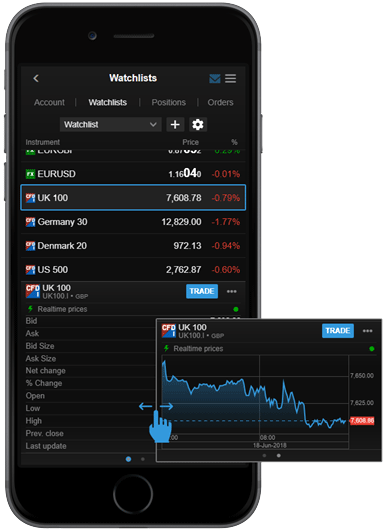
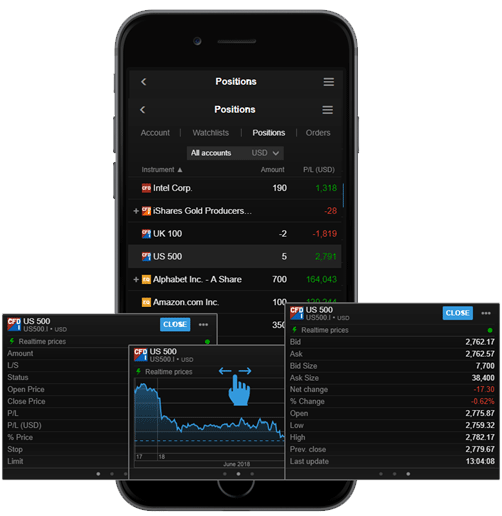
Redesigned Watchlists, Order and Positions
The Watchlist, Positions and Orders sections have been redesigned to offer a simpler layout, with easy access to detailed information through the use of info card which appear when you select an instrument.
The info cards allow you to swipe between key information for the position or order, a chart for the instrument and key market information for the instrument.
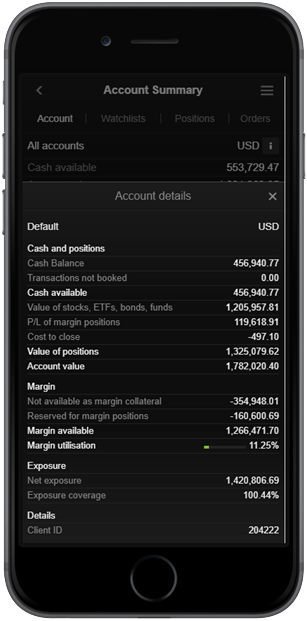
Account summary
The Account Summary was also redesigned to give an overview of all accounts and easy access to details on a particular account.
Trade Ticket
The new Trade Ticket has recently been introduced which is optimised for easier navigation and use on mobile devices with more touch-friendly controls.
Many other new features are coming to the GTS Mobile soon.
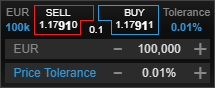
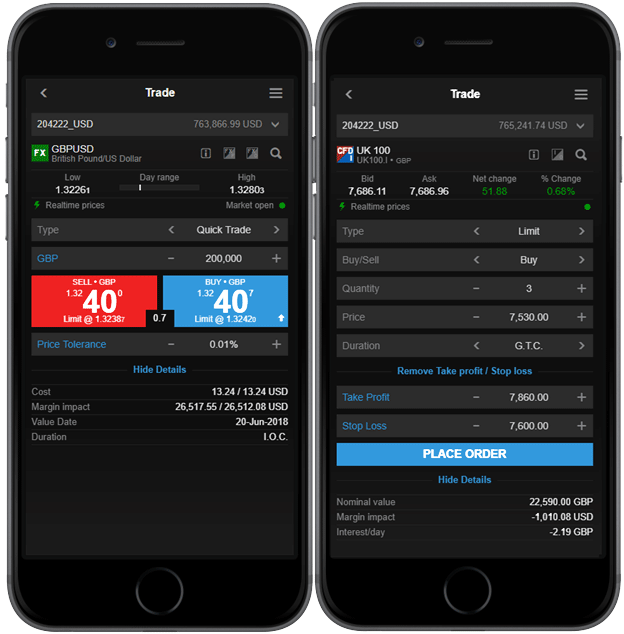
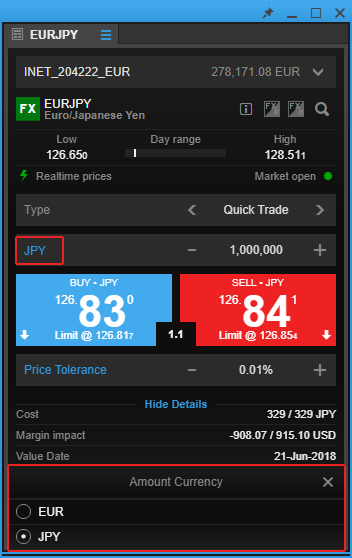
Trading in a second currency is now available in the GTS Web.
FX Quick Trades in the GTS Web now have a currency toggle on the amount selector, allowing you to select a second currency and set trade amounts in a second currency (the quote currency).
In this example, the Amount would normally be placed in EUR but you can now select to place the trade in JPY which will be converted to the EUR amount when you place the trade.
Please note that this is for convenience in converting trade amounts from the quote currency. The trade amount will always be placed in the base currency (EUR for EURJPY in this example).
Effective Monday, 9 July 2018 Global Trading LTD will improve the order checking of futures and options orders, so that the initial margin is used for the entire portfolio. The change only relates to pre-check of futures and futures options so clients without positions in these instruments are not affected.
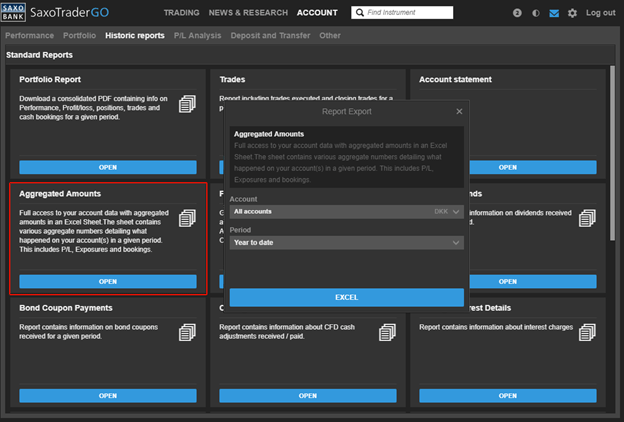
A new Aggregated Amounts tool is now available which exports aggregated amounts for your holdings into an Excel sheet. These include daily exposures, position values, P/Ls, costs and bookings and allows you to filter and process these amounts based on your own use cases.
The exported Excel sheet includes sections for:
Aggregated Amounts – a full list of relevant amounts affecting your accounts in the period
PL – The total P/L (realised +unrealised) per instrument per day
Cash movements –amounts that were booked on your account per day
Aggregated amount is available under Account > Historic reports > Aggregated amounts in the platforms.
Please note that this is for convenience in converting trade amounts from the quote currency. The trade amount will always be placed in the base currency (EUR for EURJPY in this example).
From late July 2018, we will be changing the methodology used to calculate margin impact values shown in Trade Tickets in all platforms:
Currently, the margin impact of a trade is based on the change in Margin available
From July 2018, the margin impact of a trade will be based on the change in Reserved for margin positions = Reserved for margin positions after trade – Reserved for margin positions before the trade
This change separates the margin impact from impact of costs and option premiums.
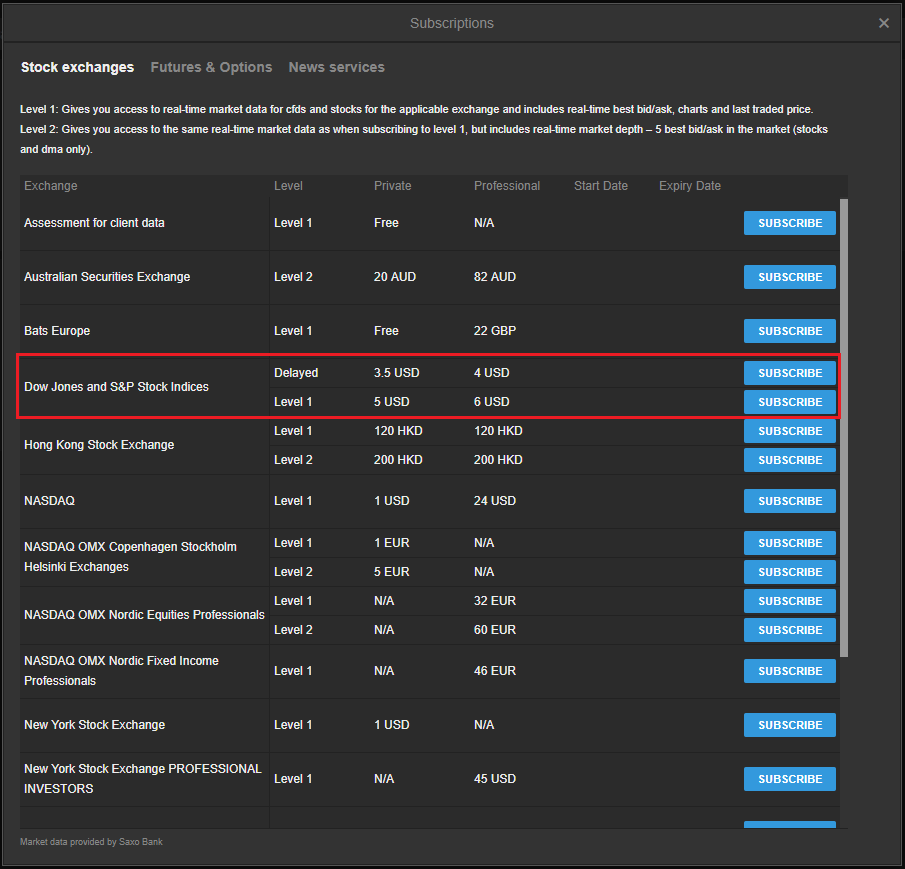
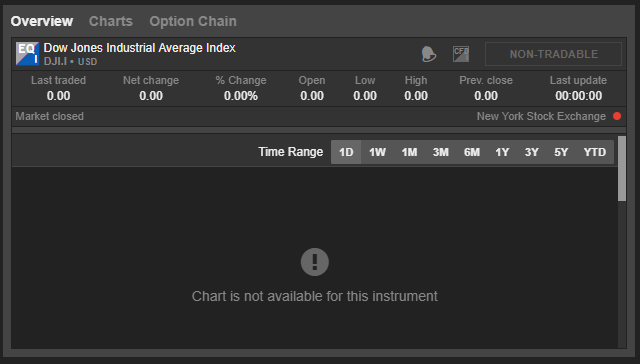
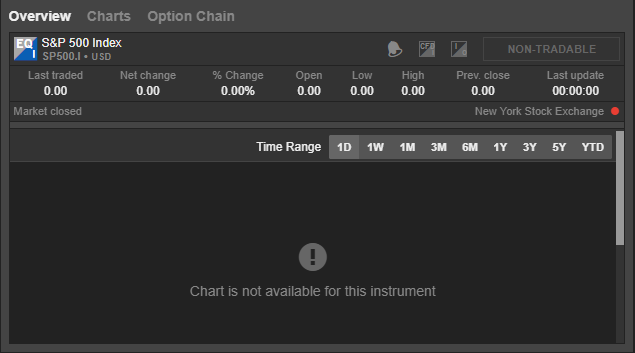
Please be advised that we are no longer going to be supporting Dow Jones and S&P stock indices subscription due to substantial increases in pricing associated with offering this subscription.
IMPORTANT: These are just the non-tradable stock indices, not exchanges. All US equities and derivatives and the DJIA and S&P Index derivatives, such as options on these indices currently offered in the platform will still be tradable.
Subscription to be removed
Current view of the instruments
Please contact trading support ([email protected]) if you have any further questions about these changes.
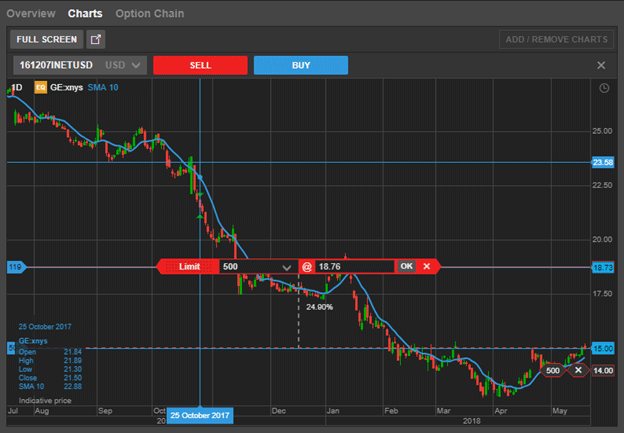
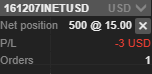
Two new buttons have been added to the chart toolbar giving access to:
Instruments where quick trading is available, quick trading as either a market or limit order with price tolerance
Placing orders on the chart
The button gives access to quick trade the instrument as a market order or limit order with price tolerance.
Click the amount to the left of the buy/sell quick trade buttons to select the trade amount. Click the Tolerance to the right of the buy/sell buttons to edit price maximum tolerance you are willing to accept.
To close the edit amount and tolerance clicking the fields again
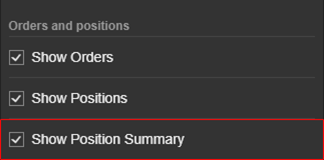
A position summary is now also available in the chart that shows your current net position on an account, the current P/L on the account and the number of open orders.
To enable/disable position summary
The position summary can be enabled/disabled using the Show Position Summary checkbox in the chart settings.
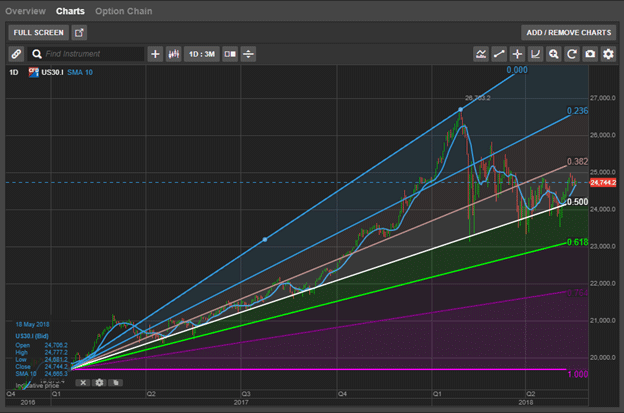
A new indicator, Fibonacci fan, is now available from the Annotations menu.
Fibonacci fans can be both rising or falling trend lines based on Fibonacci retracement levels. Fibonacci fan lines and can be used to estimate support and/or resistance levels in the financial markets.
The default Fibonacci ratios are the same as used in the other Fibonacci annotations available in the charts.
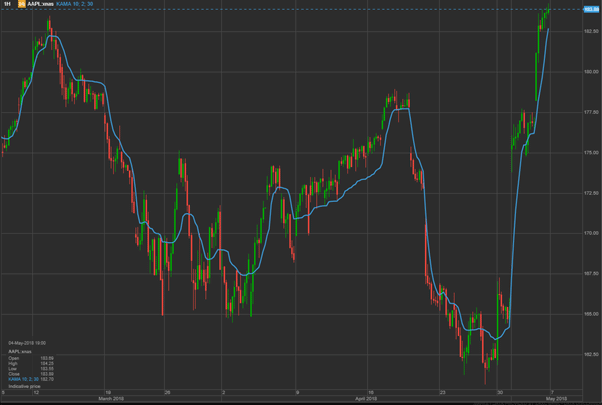
Weighted Close (WTC) indicator
Two new Indicators are now available from the Indicator menu. Weighted Close (WTC) and Kaufman’s Adaptive Moving Average (KAMA).
The Weighted Close indicator is now available from the indicators menu and is another way of looking at the price data of exchange-traded instruments. The weighted close price is an average of the price for the chart period, placing a greater emphasis on the closing price rather than the high and low. The Weighted Close indicator is calculated by multiplying the close by two, adding the high and the low to this product, and the result dividing by four. As there is only one price for Weighted Close it is shown as a line.
As you can see from the Apple chart below, the ‘normal’ close and the weighted close differ most of the time.
Kaufman’s Adaptive Moving Average (KAMA)
Kaufman’s Adaptive Moving Average (KAMA) was developed by Perry Kaufman and is a moving average, trend-following indicator that can be used to identify price turning points. It is designed to take market noise and volatility into account so that if volatility is high, the KAMA will be farther away from the current price confirming the trend and when a trend may be coming an end, the KAMA value will be closer to the market price.
The KAMA indicator differs from other moving averages such as Exponential Moving Averages which uses a weight variable, by using a constant called the ‘efficiency ratio’ to measure the strength of a trend.
The Financial Statement gives an overview of your activity on an account in the selected period.
It consists of 5 main parts:
Account Summary: shows a general overview of your opening and closing cash balances and total account values for the selected period.
*Client Activity: charges made to your account as a result of your trading activity, both for open and closed positions. This may include interest charges on negative account balances, share dividends and related withholding taxes. The section may also display cancellations of such entries.
Activity in Margin Products: P/L, commissions and related entries pertaining to closed positions in margin products (for example: forex, CFDs, futures, FX Options, contract options)
Trading Activity in Cash Products: P/L, commissions and related entries pertaining to closed positions in cash products (for example shares, ETFs and bonds)
Open Positions: shows positions in any instrument type open at the end of the selected period. For cash instruments, the value of the position is the market value. For margin instruments it is the unrealized P/L at the end of the selected period. ISIN codes are included where applicable.
*Regarding the Client Activity-section, the following definitions are often helpful:
CFD Cash Adjustment: relevant for single stock CFDs and index tracking CFDs – when a stock pays out a dividend the share price falls also the price of the CFD will fall. To reflect that this fall is not a market move, when you are long of a CFD, you will receive a cash adjustment on the ex dividend date in the same amount as the dividend on the share, typically net of an “Adjustment Fee” designed to mirror the withholding tax. When you are short in a CFD, you will benefit from the fall of the CFD’s price, and again to reflect that this is not a market move, you will pay a “CFD Cash Adjustment” designed to reflect the full dividend. CFD Index Trackers will also be adjusted in the same way when the underlying shares pay out dividends.
Return Adjustment: When a CFD Cash Adjustment is paid on a long CFD position (Also for index tracking CFDs) a Return Adjustment is subtracted, The Return Adjustment is designed to mirror the cash-flow from the default withholding tax rate in the relevant market for the underlying dividend payment.
CFD Finance: CFD finance amount paid or received for some CFD types, for example most Index Tracker CFDs at Saxo are margined products, and you finance the traded value through an overnight credit/debit charge. If you open and close a CFD position within the same trading day, you are not subject to overnight financing. You can see the relevant financing rates in your trading conditions under “CFD Financing Conditions”.
Borrowing Costs: amount paid or received on short single stock CFD positions. This is in addition to CFD Finance. If many market participants are interested in shorting a particular CFD, there will be an additional cost for shorting it because the cost of borrowing the share increases.
Service Billing Amounts: Cost related to price feed / live data costs / news-feeds that you have subscribed to.
Commission: Trading Commissions you have paid.
Corporate Actions – Fee: Fee associated with a booking of corporate action
Corporate Actions – Interest: Amount type for booking cash distribution for REITs
Corporate Actions – Fractions: Fraction compensation received from a corporate action, for example in a dividend option or stock split.
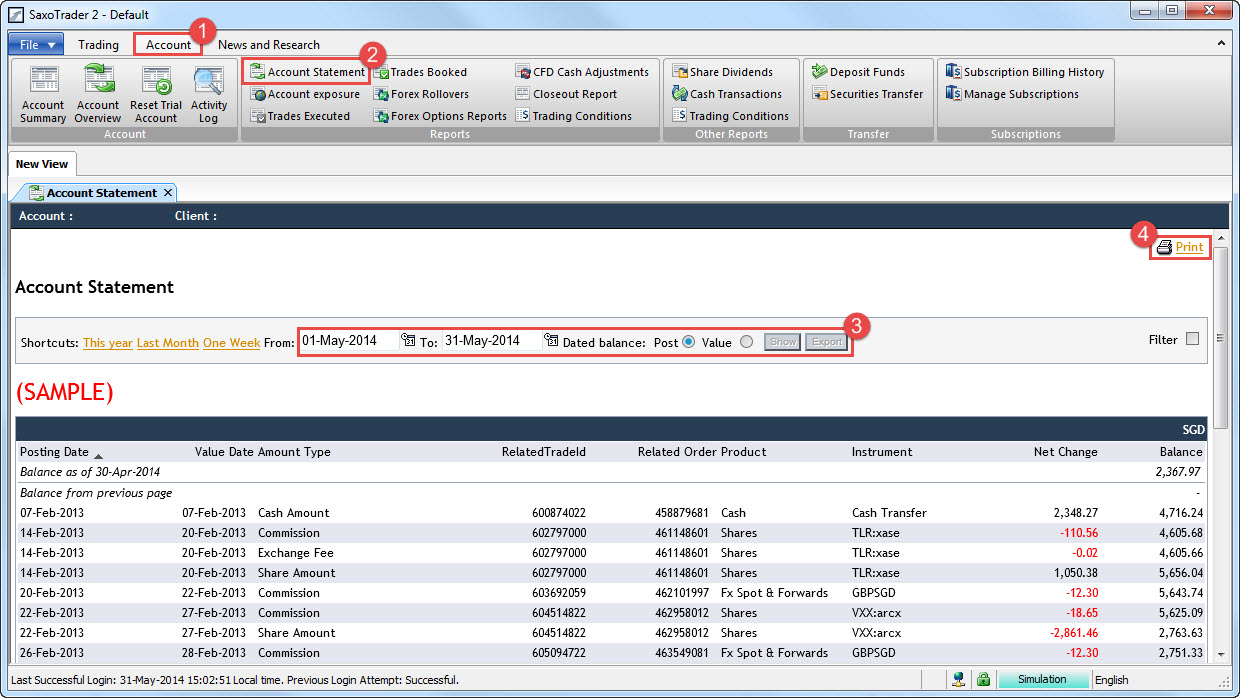
You can access the “Account Statement” via the trading platform in the “Account” tab.
When viewing the Account Statement, you can select the relevant time frame and click “Print”.
Euro Pacific Bank is no longer licensed to do business. As such, we are not accepting new customer accounts.
This website is being maintained by Peter Schiff personally as a memorial to the bank and to update customers on the status of their deposits that have been tied up in receivership since June 30, 2022, and on his personal efforts to recover those customer deposits—including gold and mutual funds—that were transferred to Qenta’s custody and which Qenta is now attempting to keep for itself rather than return to their lawful owners.
The legacy pages and links on this site are preserved solely for historical and educational purposes, to demonstrate how the bank operated while it was in business. They do not represent current offerings.
If you are interested in having an investment account managed by Peter Schiff and his team, please visit http://www.europac.com
If you are interested in buying gold, silver, or other precious metals, please visit http://www.schiffgold.com
If you are interested learning the facts about the J5 conspiracy that resulted in the shutdown of the bank visit http://www.9fraud.com
For official updates and notifications from Euro Pacific Bank’s OCIF-appointed Receiver, who holds exclusive authority to communicate with customers on behalf of the Bank, visit: https://epbprliquidation.com
 where you can edit: